Fig. 17
Download original image
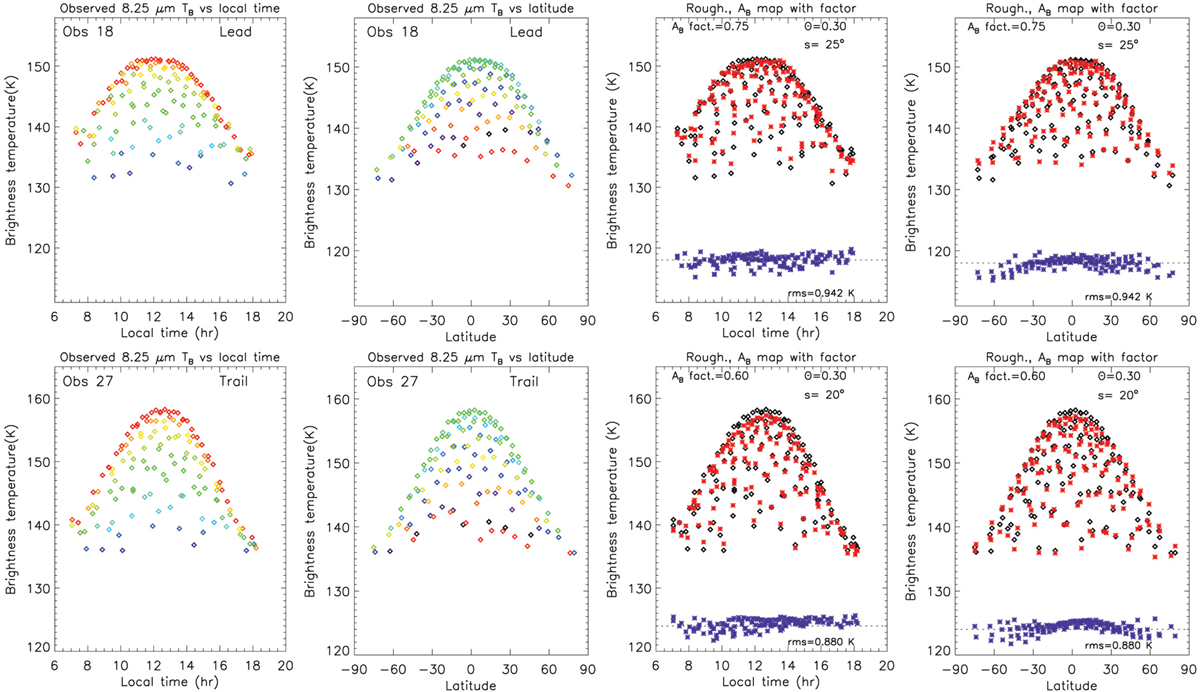
Observed and modeled 8.25-µm brightness temperature (TB). 8.25-µm TB for Obs. 18 (leading side, first row) and Obs. 27 (trailing side, second row), plotted as a function of local time (first column) or latitude (second column). The data are color-coded according to latitude (i.e., to equal values of the latitude difference from the sub-observer point) in the TB vs local time plots, and according to local time in the TB vs latitude plots. In the third and fourth columns, the data are compared to one of the best models, that includes both a rescaling of the Bond albedo map and surface roughess (see text). In these panels, data are in black, models in red, and the data minus model difference in blue, with the 0 value indicated by the dashed line. Parameter values and rms of fit are indicated in each panel.
Current usage metrics show cumulative count of Article Views (full-text article views including HTML views, PDF and ePub downloads, according to the available data) and Abstracts Views on Vision4Press platform.
Data correspond to usage on the plateform after 2015. The current usage metrics is available 48-96 hours after online publication and is updated daily on week days.
Initial download of the metrics may take a while.