Open Access
Fig. 23
Download original image
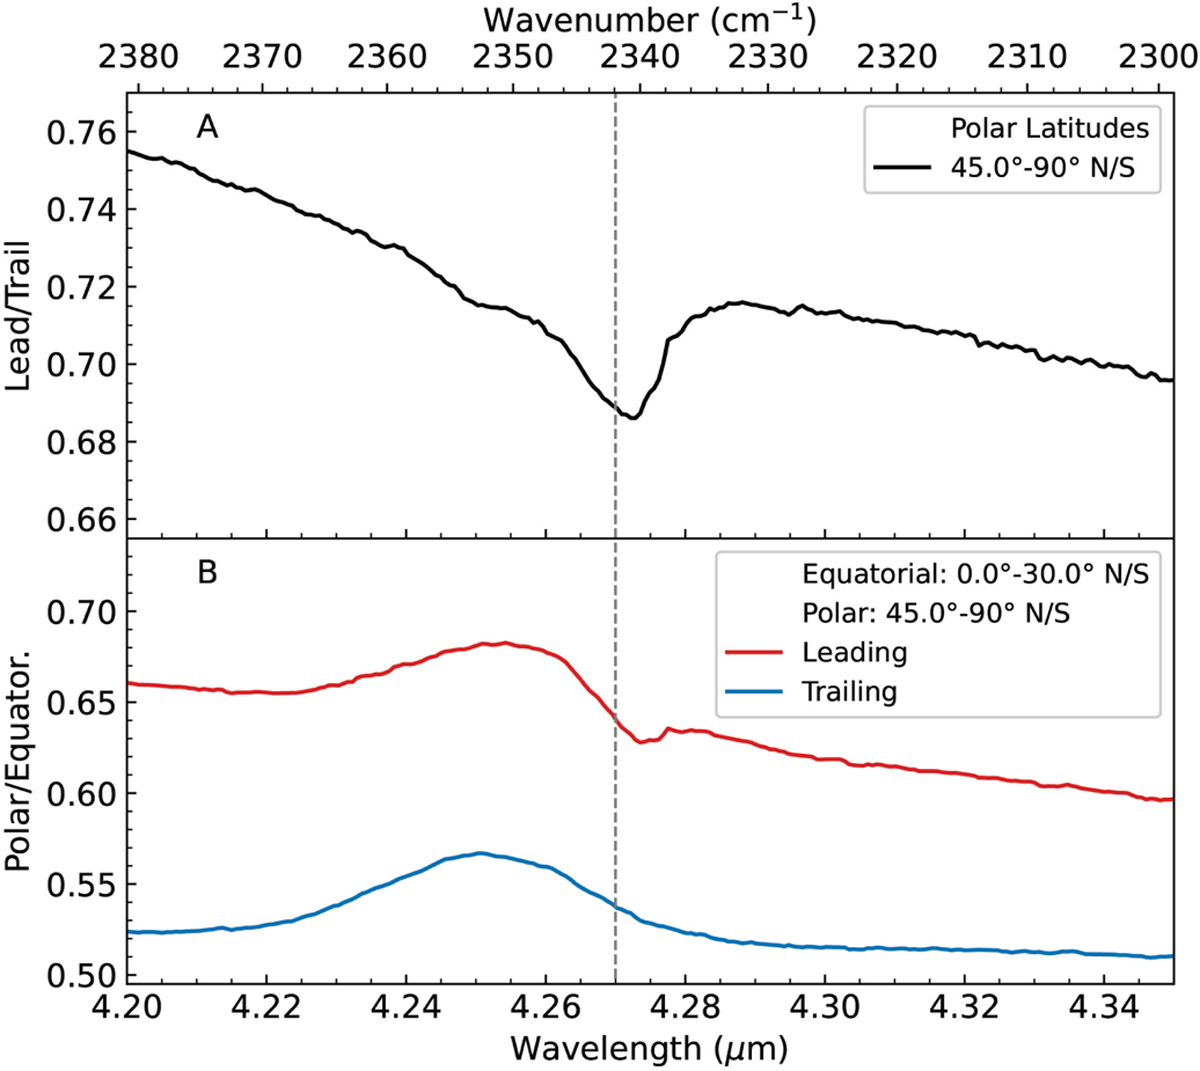
Comparison of the CO2 band in polar (>45 °N/S) and equatorial (<30 °N/S) regions through spectral ratios. (A) Spectral ratios Leading/Trailing for polar regions; (B) spectral ratios Polar/Equatorial for leading (red) and trailing (blue) hemispheres. The vertical dashed line is at 4.27 µm (2341.9 cm−1).
Current usage metrics show cumulative count of Article Views (full-text article views including HTML views, PDF and ePub downloads, according to the available data) and Abstracts Views on Vision4Press platform.
Data correspond to usage on the plateform after 2015. The current usage metrics is available 48-96 hours after online publication and is updated daily on week days.
Initial download of the metrics may take a while.