Fig. E.1
Download original image
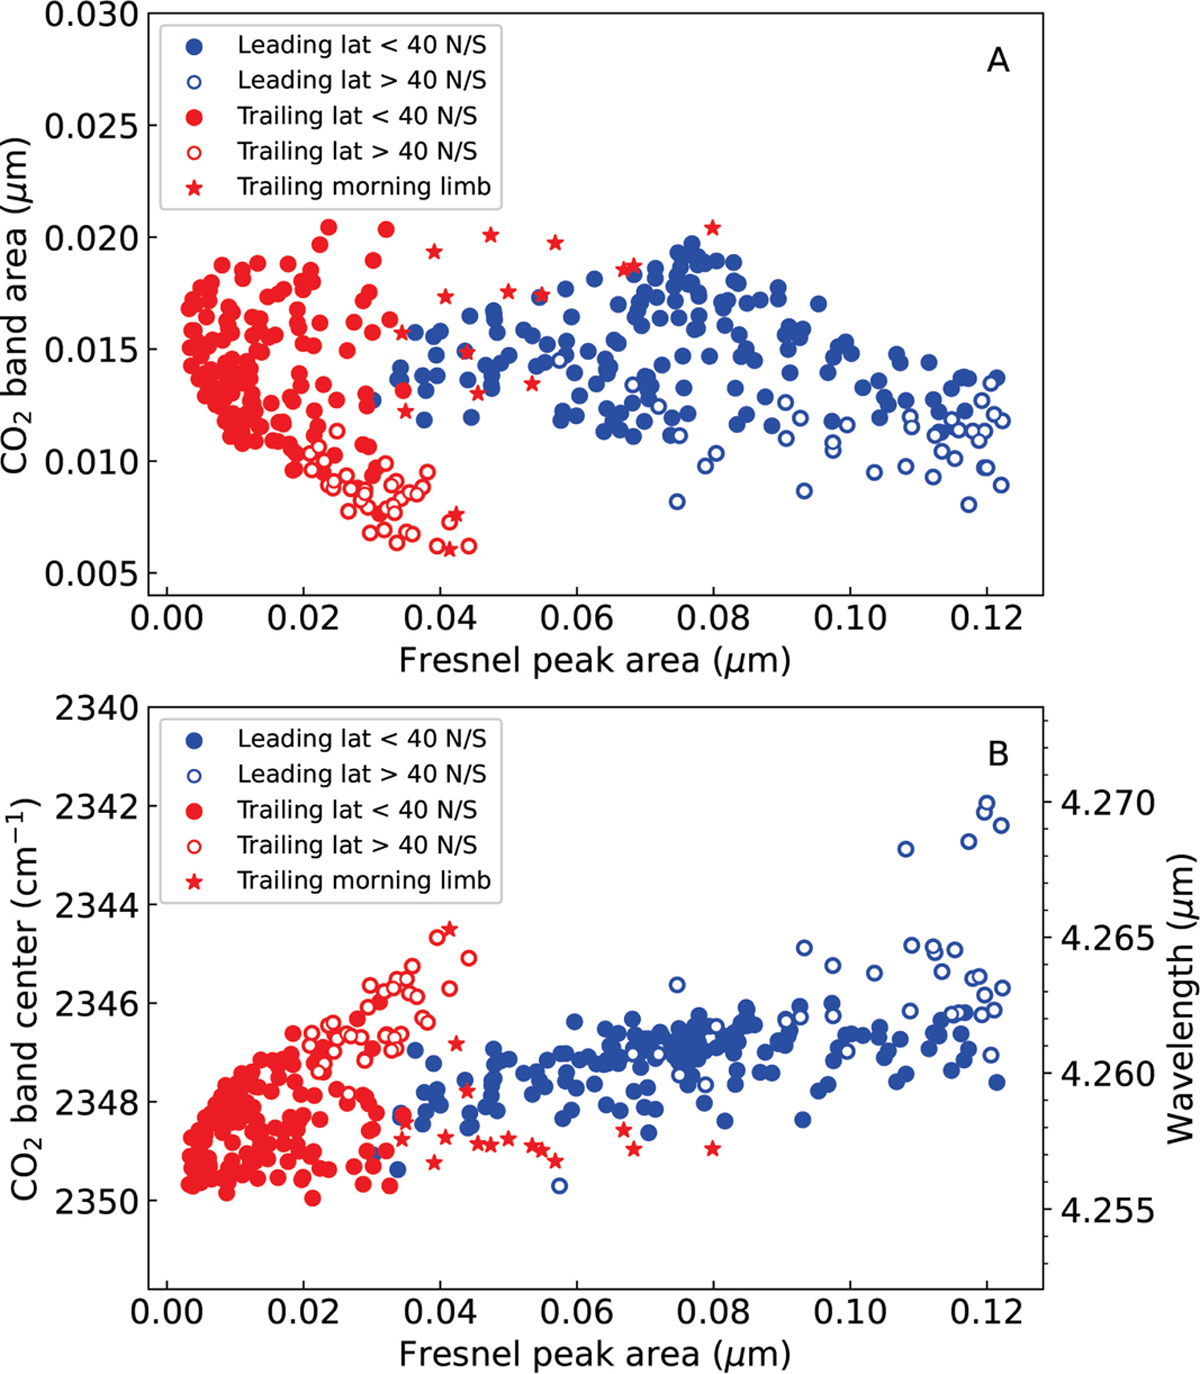
Correlations between CO2 band characteristics and water ice. CO2 band area (A) and band center (B) as a function of Fresnel-peak area (i.e., EqW). Data for the leading and trailing hemispheres are shown with blue and red symbols, respectively. Filled and open dots are for latitudes lower and higher than 40° N/S, respectively. The data in the morning limb of the trailing hemisphere (namely longitudes > 320°) are shown with the star symbol. The positive correlation between CO2 band center (in wavelength) and Fresnel peak area has a Spearman’s rank coefficient r = 0.62 and 0.52 with a significance of 6.6σ and 6.9σ for leading and trailing hemispheres, respectively. A weak negative correlation between CO2 band area and Fresnel peak area is present when considering all data (r = −0.31 (4.5σ) and r = −0.53 (6.6 σ) for leading/trailing hemispheres respectively), but not when considering only equatorial (< 40°) latitudes (r ~ 0 (0σ) and r = −0.15 (1.8 σ), for leading/trailing hemispheres, respectively). These calculations of correlation coefficients exclude data on the morning limb of the trailing hemisphere.
Current usage metrics show cumulative count of Article Views (full-text article views including HTML views, PDF and ePub downloads, according to the available data) and Abstracts Views on Vision4Press platform.
Data correspond to usage on the plateform after 2015. The current usage metrics is available 48-96 hours after online publication and is updated daily on week days.
Initial download of the metrics may take a while.