Fig. 10
Download original image
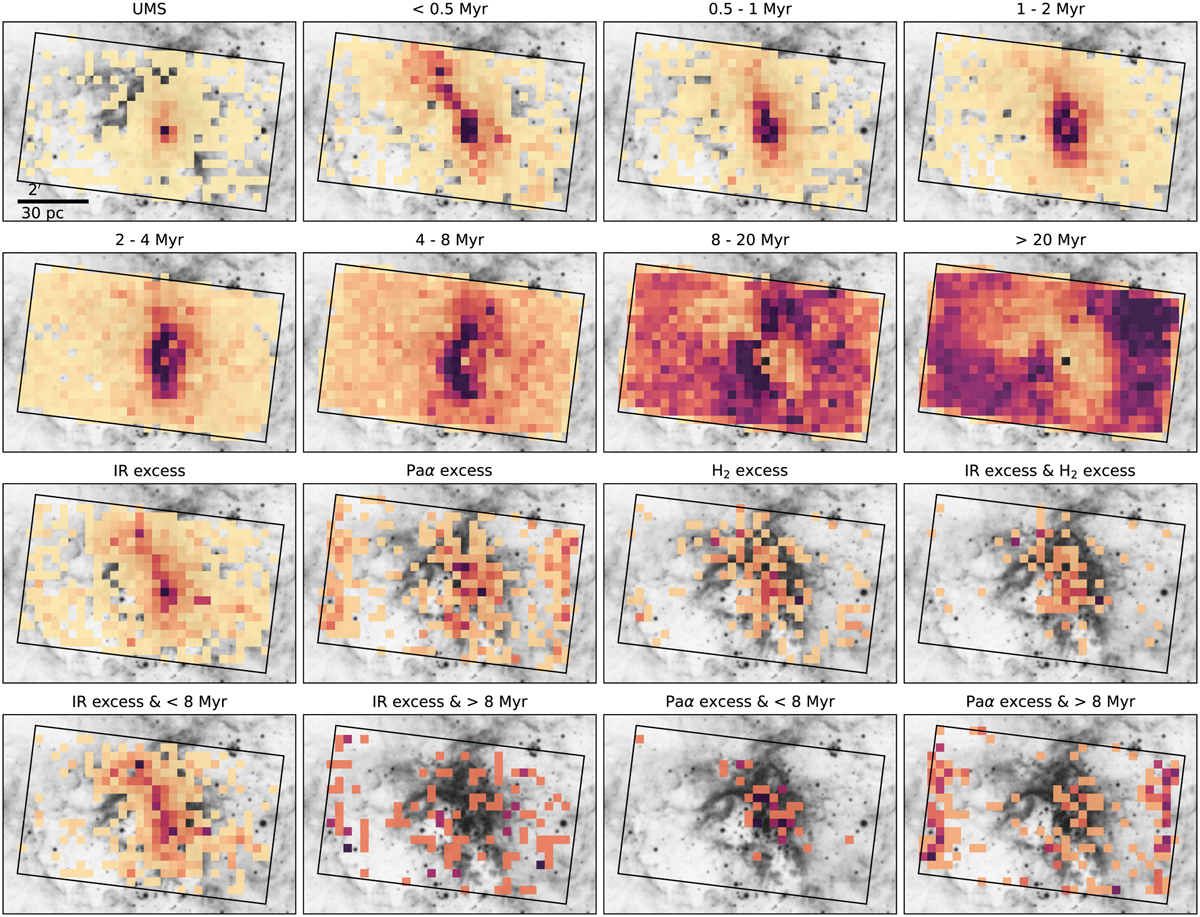
Spatial distributions of different populations of the centre field as two-dimensional histograms with 15″ bin size overlaid on the DSS2 red greyscale image. Top and first row: selections based on the F090W – F200W colour magnitude diagram and comparisons with isochrones as shown by two-dimensional histograms. Third row: histograms show individual stars selected based on their excess. Bottom row: histograms showing stars that fall in two or more selections. A scale bar of 2′ is shown in the first panel.
Current usage metrics show cumulative count of Article Views (full-text article views including HTML views, PDF and ePub downloads, according to the available data) and Abstracts Views on Vision4Press platform.
Data correspond to usage on the plateform after 2015. The current usage metrics is available 48-96 hours after online publication and is updated daily on week days.
Initial download of the metrics may take a while.