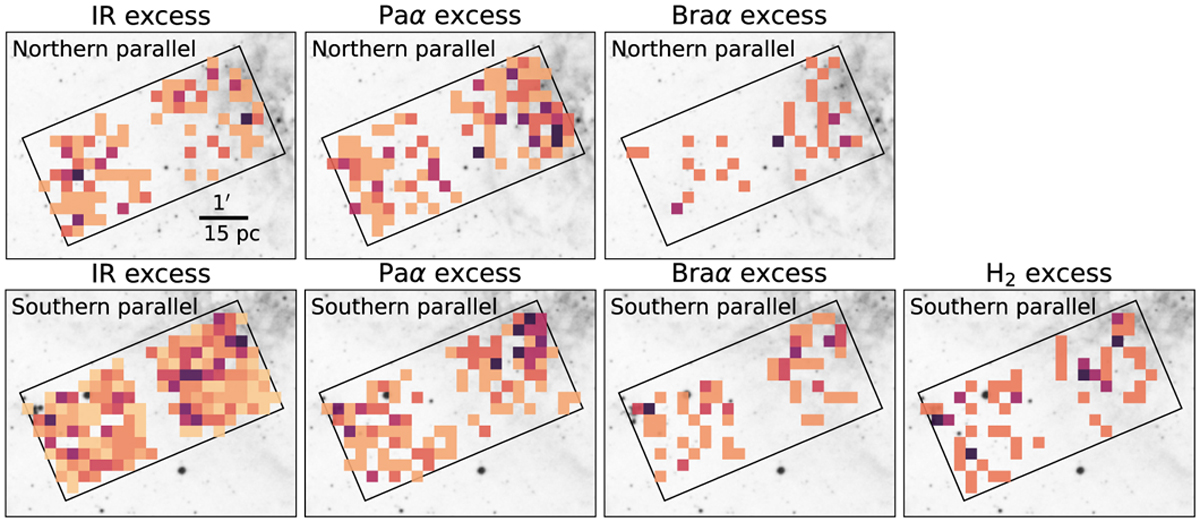
Fig. 11
Download original image
Spatial distributions of different populations of the northern (top) and southern parallels (bottom) as two-dimensional histograms with 15″ bin size overlaid on the DSS2 red greyscale image (see Fig. 1 for the placement of these fields in the 30 Doradus region). Histograms show individual stars selected based on their excess.
Current usage metrics show cumulative count of Article Views (full-text article views including HTML views, PDF and ePub downloads, according to the available data) and Abstracts Views on Vision4Press platform.
Data correspond to usage on the plateform after 2015. The current usage metrics is available 48-96 hours after online publication and is updated daily on week days.
Initial download of the metrics may take a while.