Fig. 12
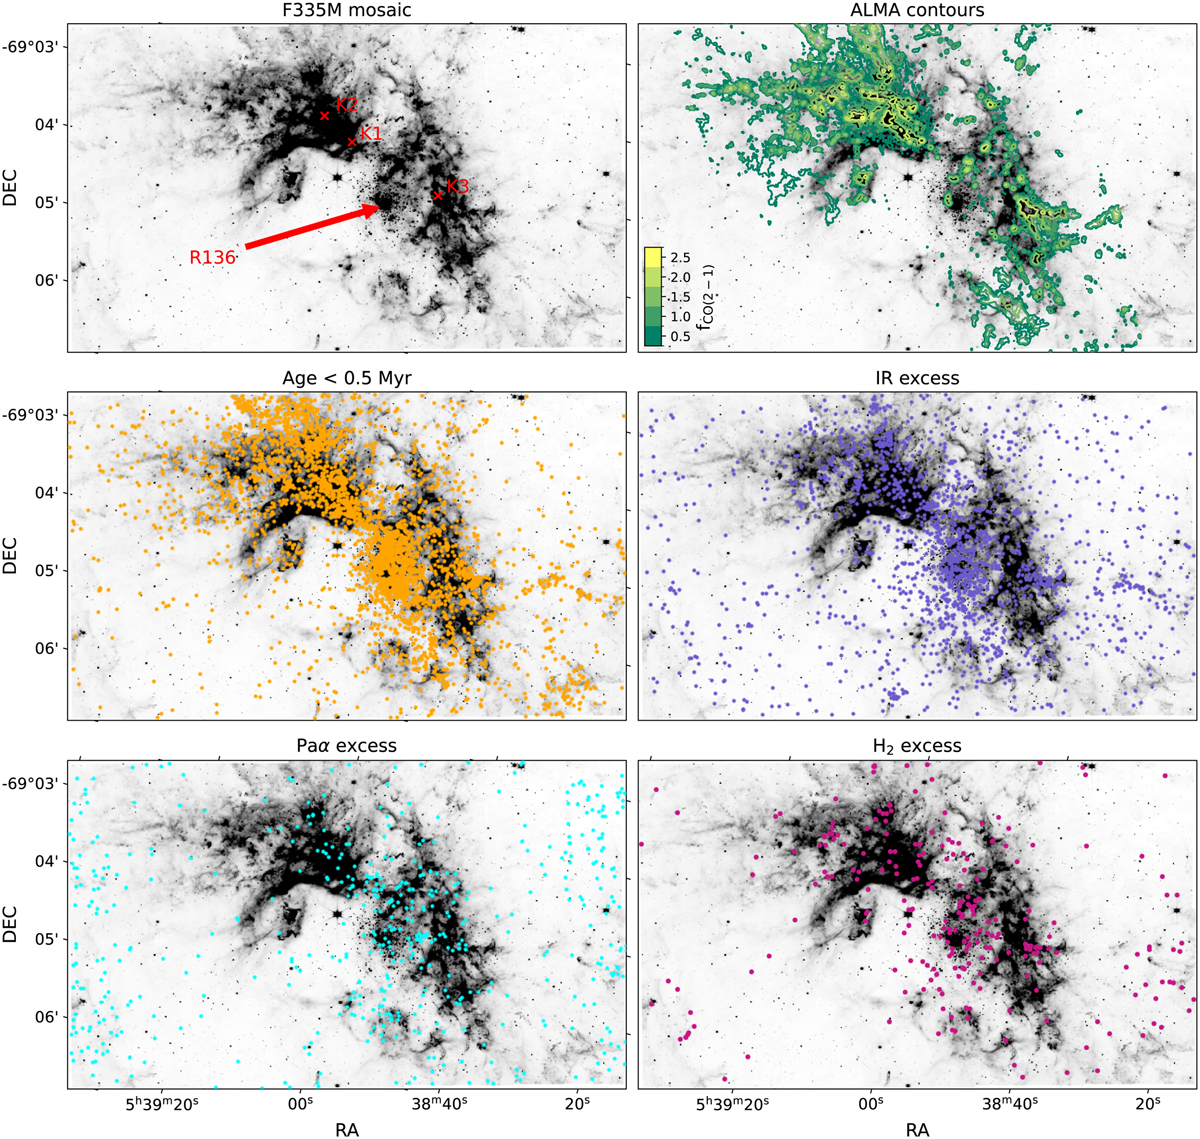
Download original image
Spatial distribution of different populations in the centre field on top of the F335M mosaic (top left and as background in each panel). The red arrow indicates the location of the central cluster R 136, and the red crosses mark the positions of previously well-studied IR-bright knots (e.g. Walborn et al. 1999). Top right: 12CO moment zero maps from ALMA (data from Wong et al. 2022) as green to yellow contours. The coloured dots show individual stars selected in different populations. The image has a field of view of 7.4′ × 4.4′ (110 × 66 pc).
Current usage metrics show cumulative count of Article Views (full-text article views including HTML views, PDF and ePub downloads, according to the available data) and Abstracts Views on Vision4Press platform.
Data correspond to usage on the plateform after 2015. The current usage metrics is available 48-96 hours after online publication and is updated daily on week days.
Initial download of the metrics may take a while.