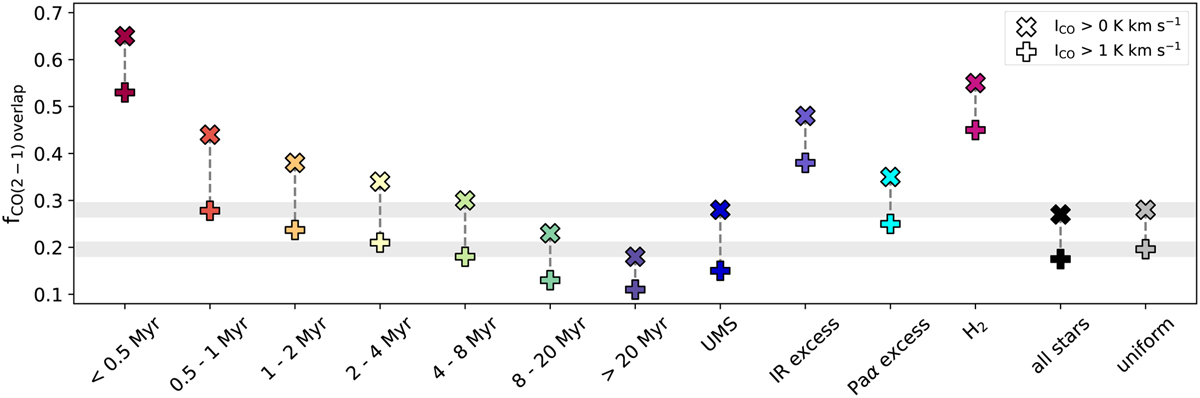
Fig. 13
Download original image
Fraction of sources in different selections that overlap with the ALMA CO(2–1) map from Wong et al. (2022). The cross shows the fraction of overlap without any intensity constraint, the plusses show the overlap with regions in which the CO intensity exceeds 1.0 K km s−1. The black symbols refer to the full JWST catalogue, and the grey symbols and bands show the expected values for a uniform distribution of stars across the field of view with both JWST and ALMA coverage. These values are higher than for the old stars (>20 Myr) because only a few are detected in the highly extinguished regions.
Current usage metrics show cumulative count of Article Views (full-text article views including HTML views, PDF and ePub downloads, according to the available data) and Abstracts Views on Vision4Press platform.
Data correspond to usage on the plateform after 2015. The current usage metrics is available 48-96 hours after online publication and is updated daily on week days.
Initial download of the metrics may take a while.