Fig. 9
Download original image
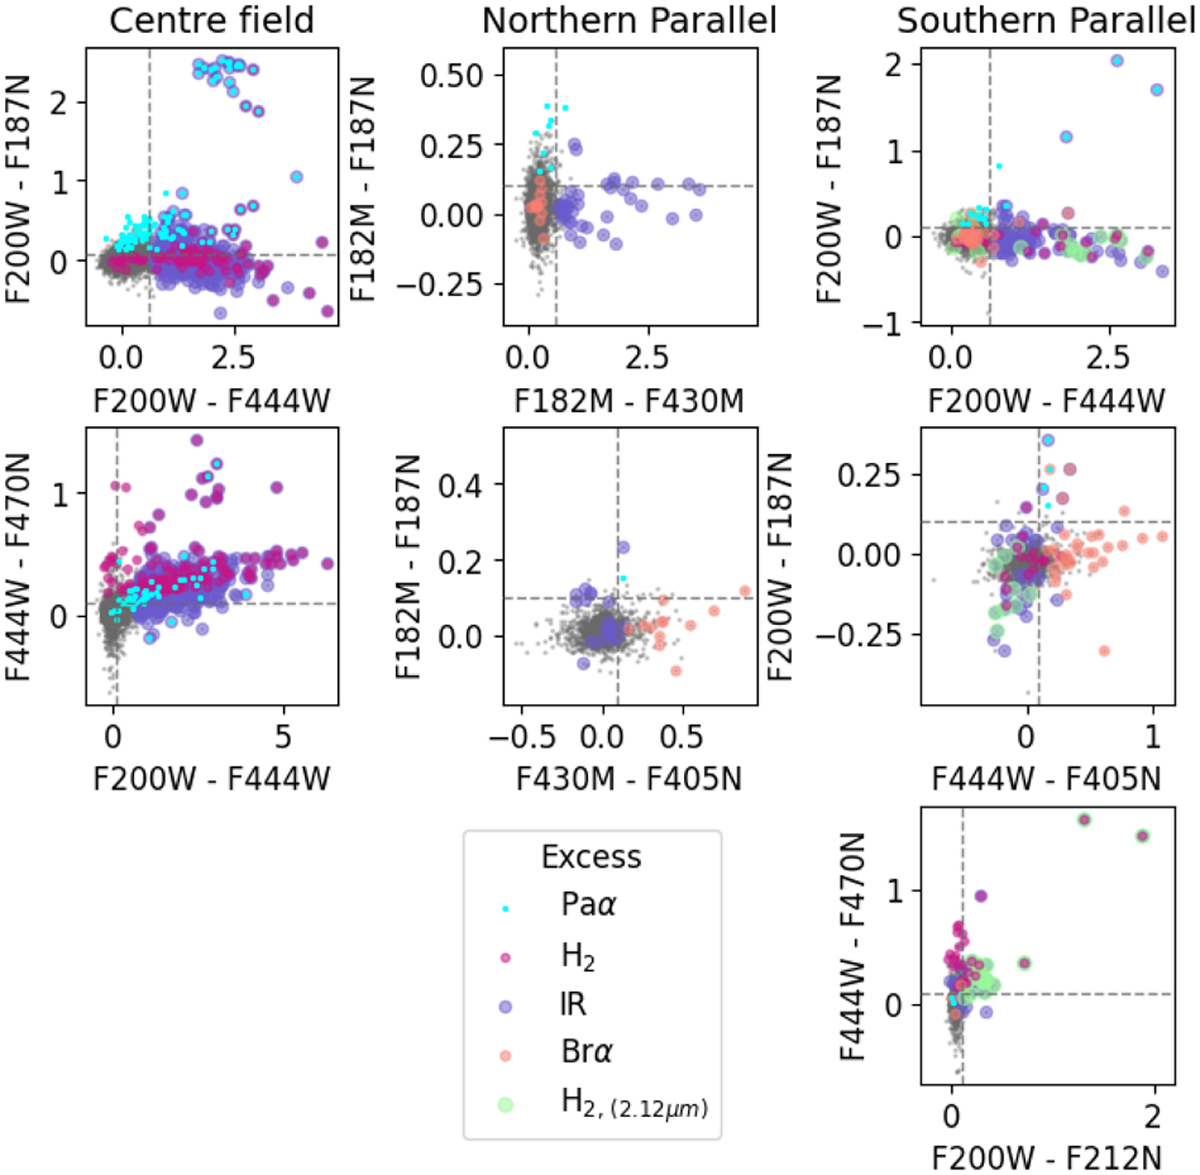
Colour-colour diagrams used to select sources with excess emission due to warm dust or emission lines. Left panels: selection of sources in the centre field with Paα (cyan), H2 (magenta), and IR (purple) excess. Middle panels: selection of sources in the northern parallel field with Paα (cyan), Brα (peach), and IR (purple) excess. Right panels: selection of sources in the southern parallel field with Paα (cyan), H2 (4.70 µm, magenta), H2 (2.12 µm, pale green), Brα (peach), and IR (purple) excess.
Current usage metrics show cumulative count of Article Views (full-text article views including HTML views, PDF and ePub downloads, according to the available data) and Abstracts Views on Vision4Press platform.
Data correspond to usage on the plateform after 2015. The current usage metrics is available 48-96 hours after online publication and is updated daily on week days.
Initial download of the metrics may take a while.