Fig. 4
Download original image
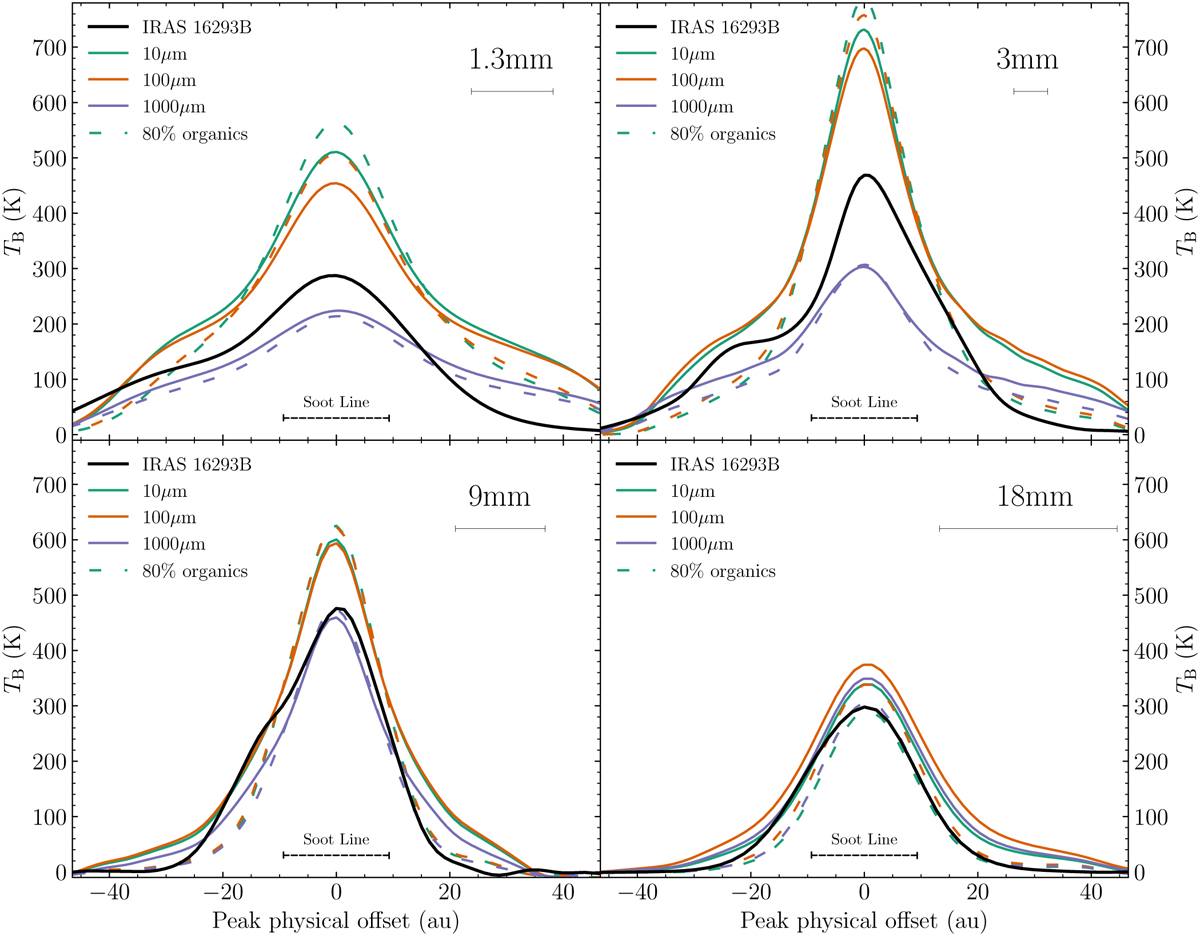
Cuts of the brightness temperature distribution along the east-west axis for real and synthetic observations at four wavelengths. The black solid line in each panel represents the ALMA and VLA observations shown in Fig. 1. The colored lines indicate models with different maximum dust grain sizes, taking values of amax = 10, 100, and 1000 µm. We include models accounting for the sublimation of 80% of the carbonaceous material in the form of refractory organics. The sublimation zone extends over a 10 au radius where the gas temperature exceeds 300 K. The black line under every wavelength label indicates the angular resolution.
Current usage metrics show cumulative count of Article Views (full-text article views including HTML views, PDF and ePub downloads, according to the available data) and Abstracts Views on Vision4Press platform.
Data correspond to usage on the plateform after 2015. The current usage metrics is available 48-96 hours after online publication and is updated daily on week days.
Initial download of the metrics may take a while.