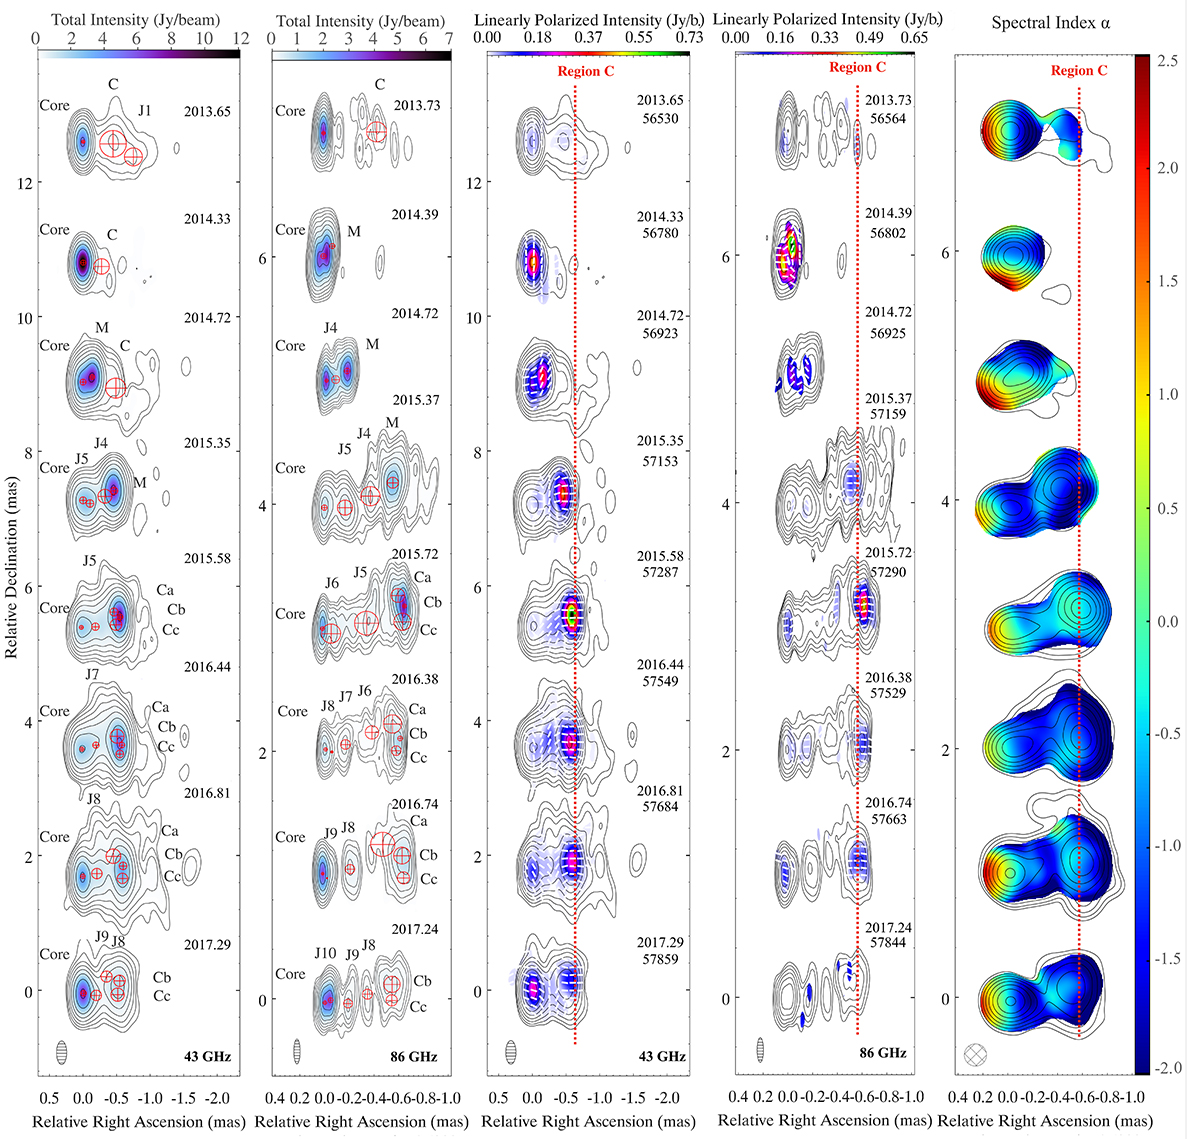
Fig. 1.
Download original image
Close-in-time total intensity, polarization, and spectral index images of the blazar 3C 454.3 at 43 and 86 GHz from 2013 to 2017. The contour levels at 43 GHz are set to 0.11, 0.24, 0.57, 1.32, 3.07, 7.15, 16.33, 38.69, and 90% of the peak total intensity of 12.2 Jy beam−1; whereas at 86 GHz they are set to 0.49, 1.17, 2.80, 6.66, 15.87, 37.79, and 90% of the peak total intensity of 4.7 Jy beam−1. The 43 GHz images are convolved with an indicative common restoring beam of 0.35 × 0.15 mas oriented at position angle (PA) 0°, whereas the 86 GHz maps are convolved with a beam of 0.2 × 0.05 mas. Left two panels: Stokes I images of the source. The data were imaged using a uniform weighting scheme, and the color scale visualizes the total intensity of each image. The red circles represent all the 2D Gaussian components that model the flux density distribution along the jet at each epoch. Middle two panels: Polarization images of the same source. The color scale visualizes the linearly polarized intensity of each image, whereas the white sticks show the EVPAs. Right panel: Spectral index maps between the 43 GHz and 86 GHz. These maps were obtained after convolution with a mean circular beam of 0.16 mas and a mean pixel size of 0.007 mas. Lastly, the vertical red dotted line indicates the approximate location of region C.
Current usage metrics show cumulative count of Article Views (full-text article views including HTML views, PDF and ePub downloads, according to the available data) and Abstracts Views on Vision4Press platform.
Data correspond to usage on the plateform after 2015. The current usage metrics is available 48-96 hours after online publication and is updated daily on week days.
Initial download of the metrics may take a while.