Fig. 2.

Download original image
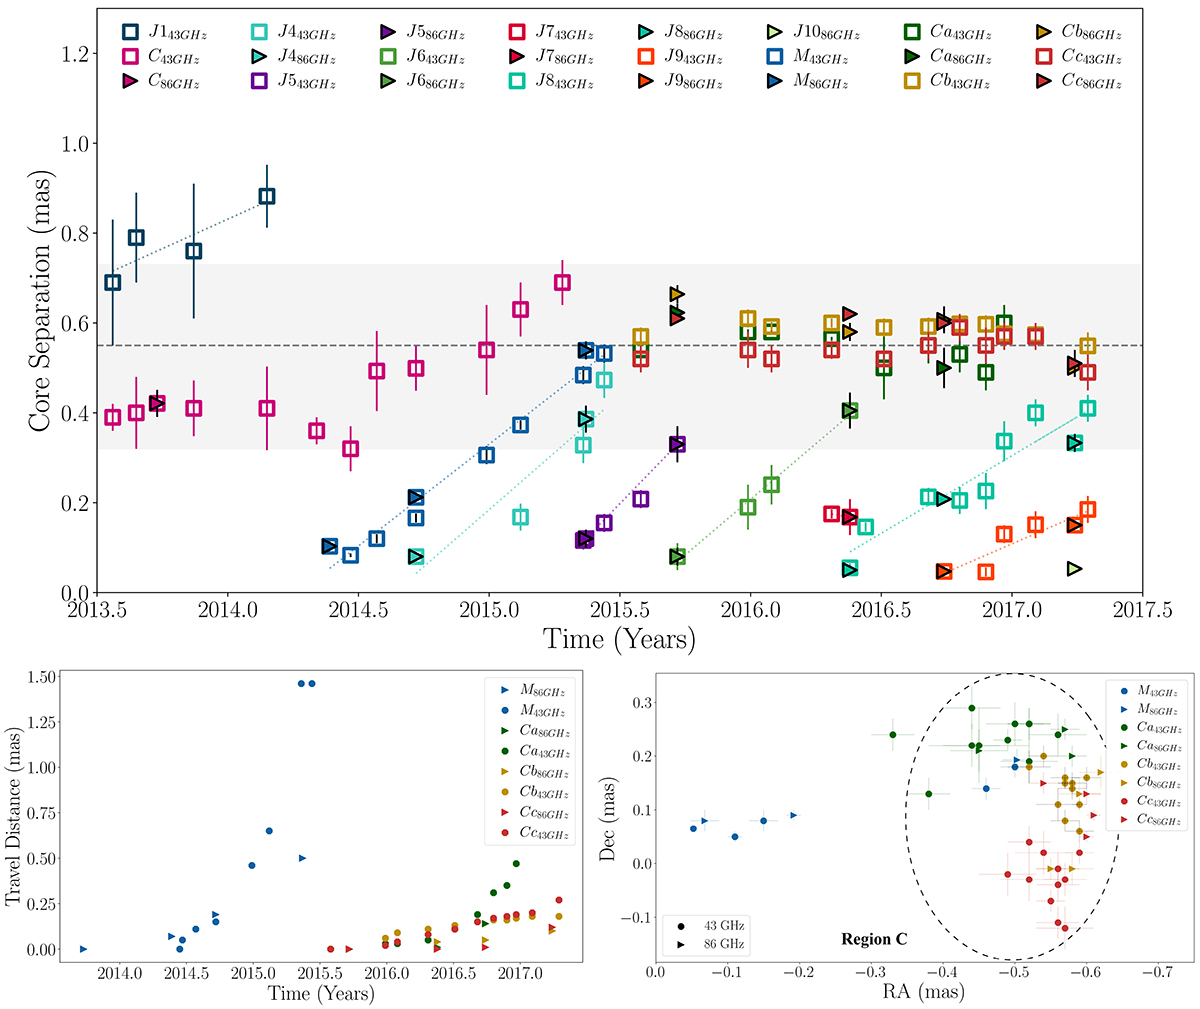
A comprehensive view of the spatial and temporal dynamics of 3C 454.3 during the period 2013–2017. Upper panel: Radial core separation versus time of all the identified jet components in 3C 454.3. The dashed, horizontal line designates the mean position of region C during our observing interval, whereas the gray shadowed area represents the positional range that region C has been reported by this and previous studies. Lower-left panel: Travel distance evolution of knots M, Ca, Cb, and Cc. Lower-right panel: Relative right ascension and declination with respect to the VLBI core of components M, Ca, Cb, and Cc. The dashed, grey ellipsis highlights the location of region C relative to the core.
Current usage metrics show cumulative count of Article Views (full-text article views including HTML views, PDF and ePub downloads, according to the available data) and Abstracts Views on Vision4Press platform.
Data correspond to usage on the plateform after 2015. The current usage metrics is available 48-96 hours after online publication and is updated daily on week days.
Initial download of the metrics may take a while.


