Fig. 4
Download original image
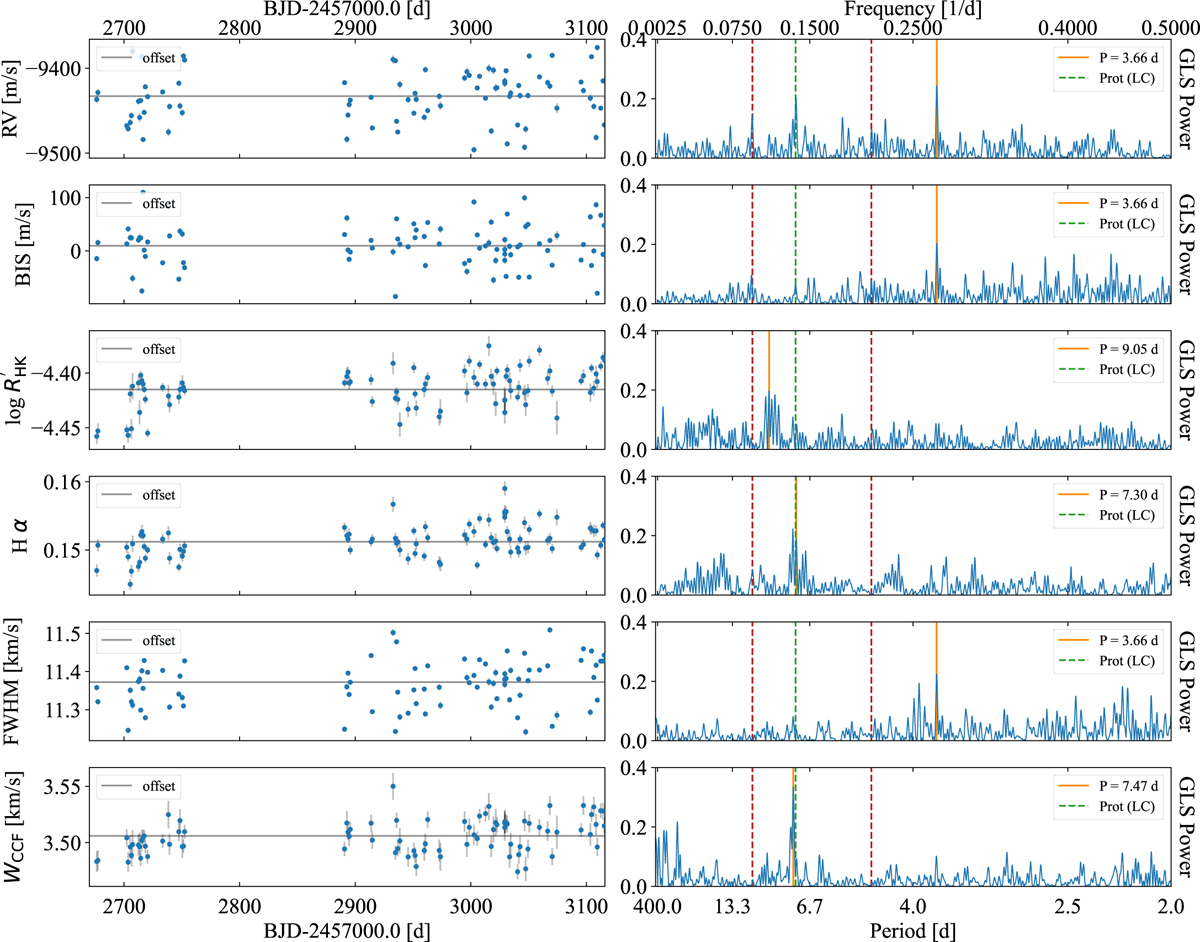
Spectroscopic time series and GLS periodograms. Left: HARPS-N spectroscopic time series used in this work. The time series for RV, BIS. ![]() , Hα, FWHM, and WCCF are shown in the panels in order from top to bottom. Right: GLS periodogram of the RVs and the spectroscopic activity indicators under analysis. The primary peak of each periodogram is indicated by a vertical orange line. The dotted green lines represent the stellar rotation period described in Sect. 2.2. The signals along the red dotted vertical lines correspond to the transit-like signals with periods 4.77 and 10.59 d.
, Hα, FWHM, and WCCF are shown in the panels in order from top to bottom. Right: GLS periodogram of the RVs and the spectroscopic activity indicators under analysis. The primary peak of each periodogram is indicated by a vertical orange line. The dotted green lines represent the stellar rotation period described in Sect. 2.2. The signals along the red dotted vertical lines correspond to the transit-like signals with periods 4.77 and 10.59 d.
Current usage metrics show cumulative count of Article Views (full-text article views including HTML views, PDF and ePub downloads, according to the available data) and Abstracts Views on Vision4Press platform.
Data correspond to usage on the plateform after 2015. The current usage metrics is available 48-96 hours after online publication and is updated daily on week days.
Initial download of the metrics may take a while.