Open Access
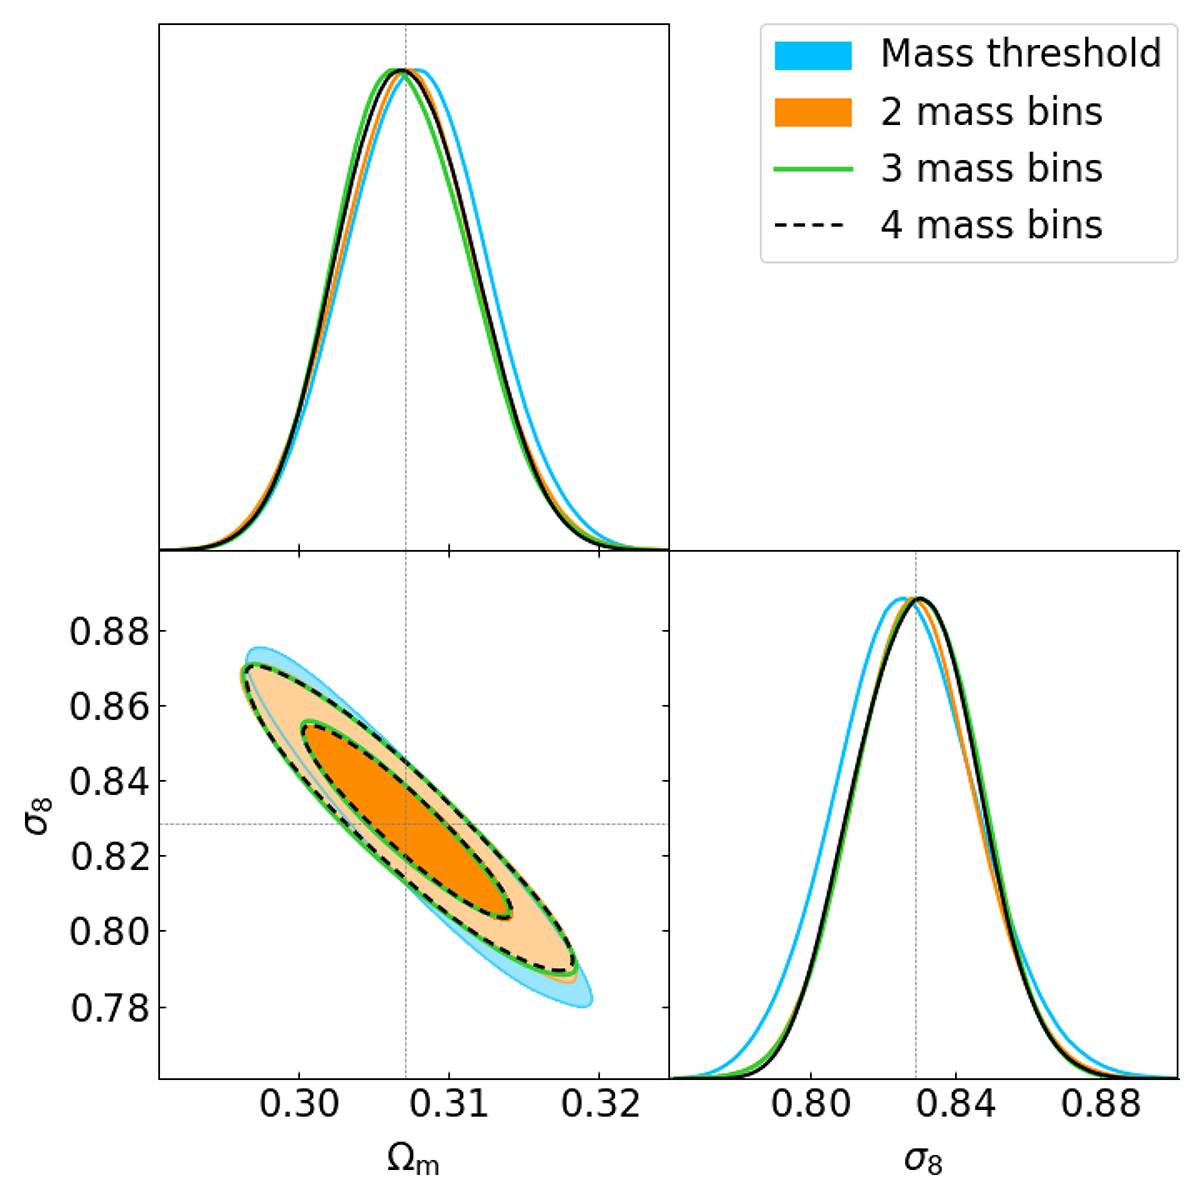
Fig. 10.
Download original image
Contour plots at 68 and 95% of the confidence level for three cases: no mass binning (blue), two mass bins (orange), and three mass bins (black). In all the cases, the covariance is given by the numerical matrix. The dotted gray lines represent the fiducial cosmology.
Current usage metrics show cumulative count of Article Views (full-text article views including HTML views, PDF and ePub downloads, according to the available data) and Abstracts Views on Vision4Press platform.
Data correspond to usage on the plateform after 2015. The current usage metrics is available 48-96 hours after online publication and is updated daily on week days.
Initial download of the metrics may take a while.