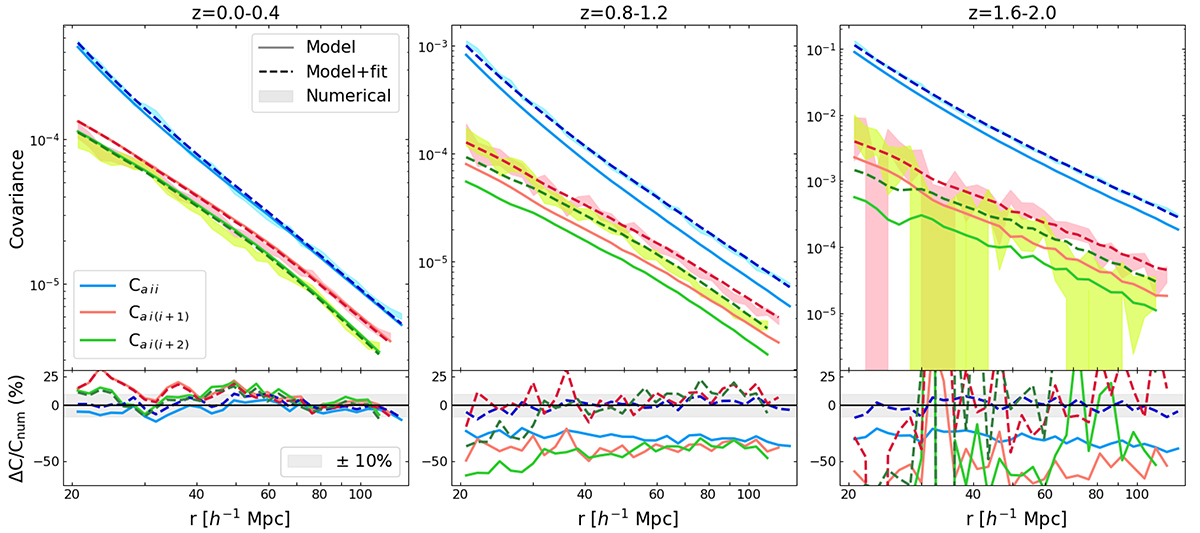
Fig. 4.
Download original image
Numerical (shaded areas), analytical (solid lines), and analytical with fitted parameters (dashed lines) covariance matrices as a function of the radial separation in three redshift bins (from left to right: z = 0.0 − 0.4, z = 0.8 − 1.2, z = 1.6 − 2.0). The different colors represent different components of the matrix. The diagonal elements are plotted in blue, the first off-diagonal elements are shown in red, and the second off-diagonal elements are shown in green. The subpanels show the percent residuals of the model covariance with respect to the numerical matrix.
Current usage metrics show cumulative count of Article Views (full-text article views including HTML views, PDF and ePub downloads, according to the available data) and Abstracts Views on Vision4Press platform.
Data correspond to usage on the plateform after 2015. The current usage metrics is available 48-96 hours after online publication and is updated daily on week days.
Initial download of the metrics may take a while.