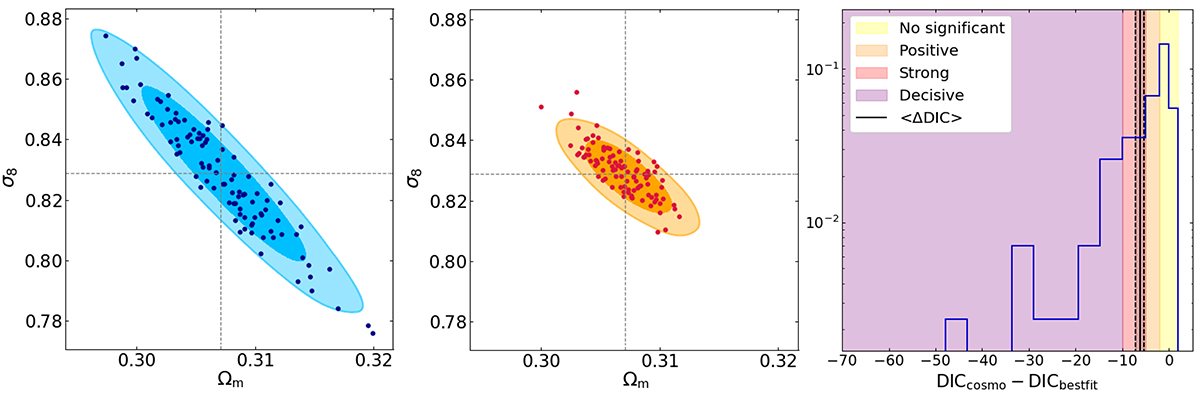
Fig. 7.
Download original image
Comparison of 100 light cones analyzed individually with the cosmology-dependent and the fixed-cosmology covariance matrices. Left and middle panels: contour plots at 68 and 95% of the confidence level for input-cosmology covariance (blue) and the cosmology-dependent covariance (orange) obtained from the mean likelihood (Eq. (18)). The dots show the best-fit values from 100 single light cones. The gray lines represent the input parameters. Right panel: ΔDIC distribution of the 100 light cones. The associated mean and the error on the mean are highlighted as solid and dashed black lines. The colored regions represent the Jeffery scale used to interpret the results.
Current usage metrics show cumulative count of Article Views (full-text article views including HTML views, PDF and ePub downloads, according to the available data) and Abstracts Views on Vision4Press platform.
Data correspond to usage on the plateform after 2015. The current usage metrics is available 48-96 hours after online publication and is updated daily on week days.
Initial download of the metrics may take a while.