Fig. 5
Download original image
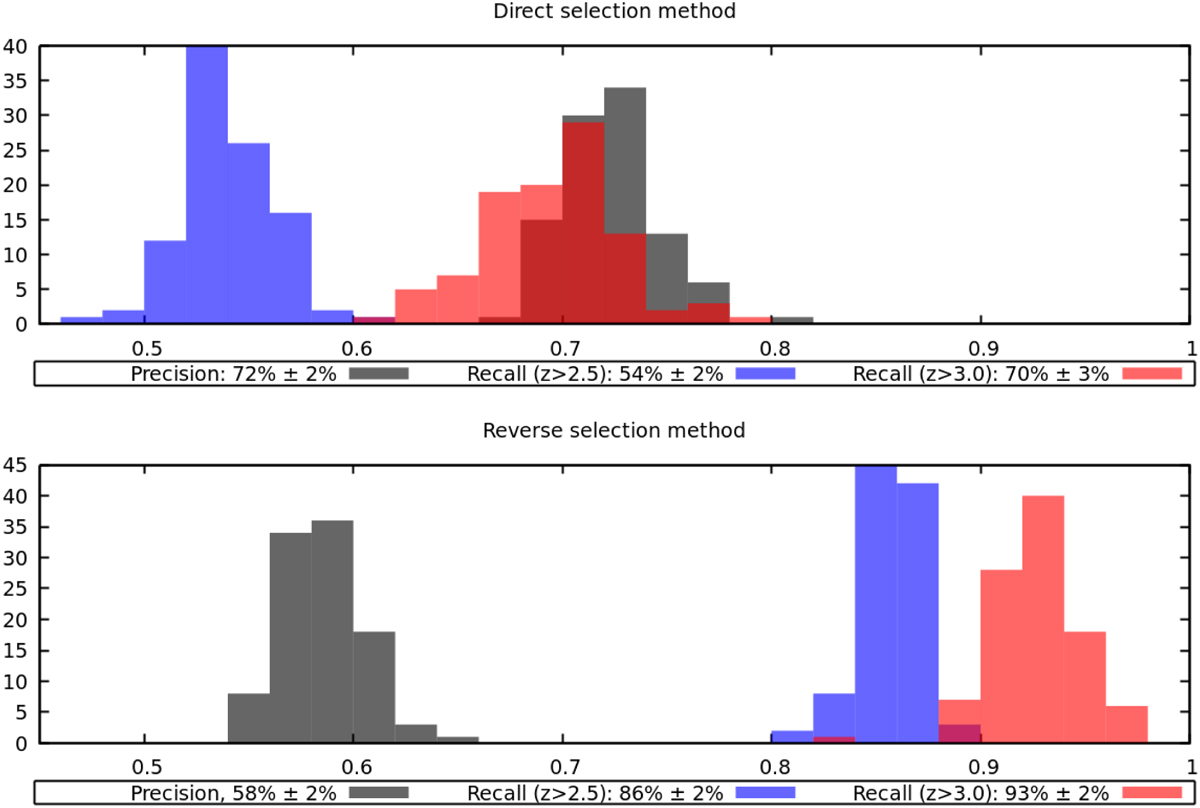
Distributions of precision (black histogram) and recall (blue histogram for the sample of high-z QSOs with z > 2.5, red histogram for the sample with z > 3) as measured on 100 randomly selected test datasets (Sect. 5.6). The upper panel shows the results obtained with the direct selection method (Sect. 5.3) while the lower panel shows the same quantities obtained with the reverse selection method (Sect. 5.5).
Current usage metrics show cumulative count of Article Views (full-text article views including HTML views, PDF and ePub downloads, according to the available data) and Abstracts Views on Vision4Press platform.
Data correspond to usage on the plateform after 2015. The current usage metrics is available 48-96 hours after online publication and is updated daily on week days.
Initial download of the metrics may take a while.