Open Access
Fig. 1
Download original image
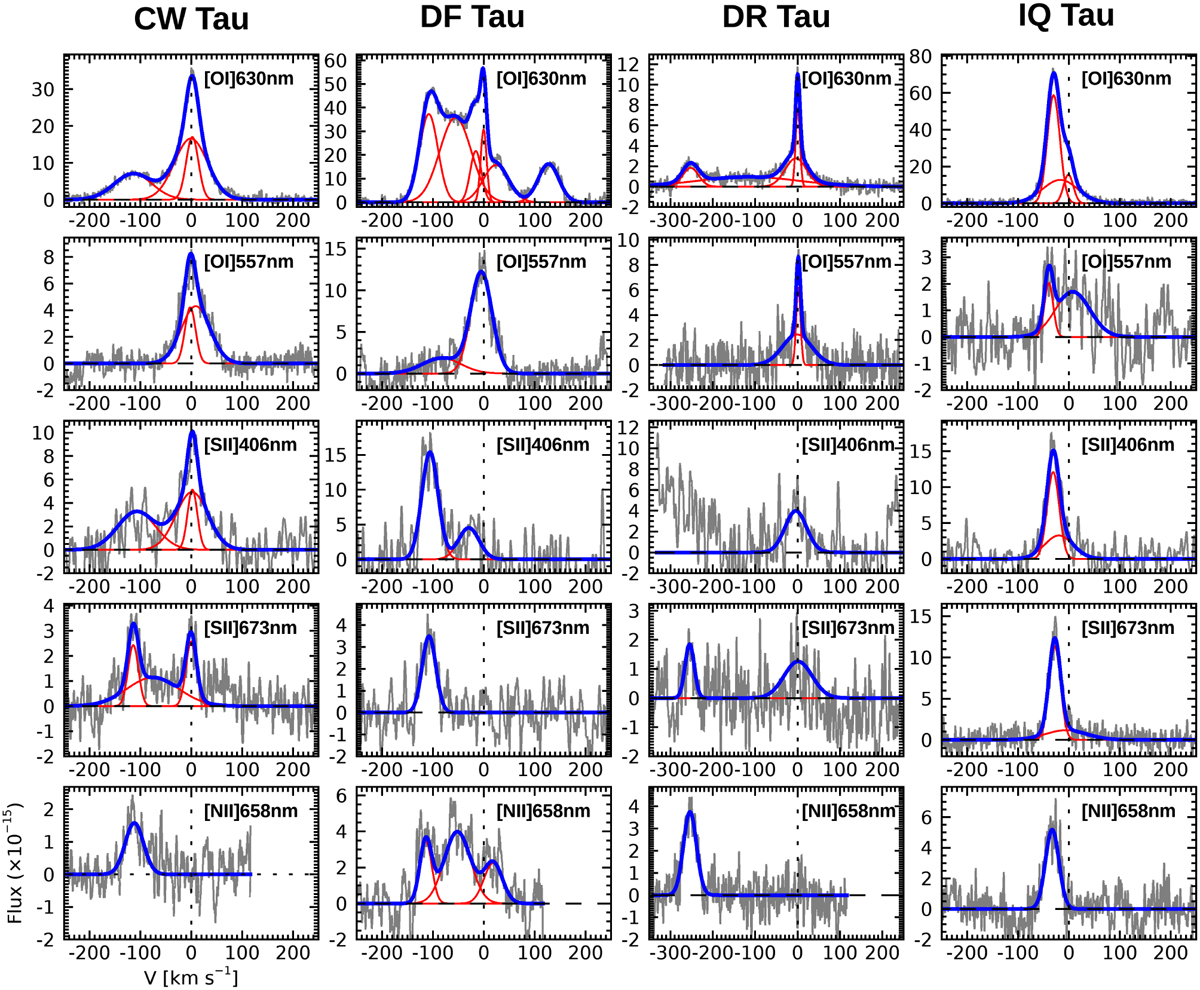
Representative continuum-subtracted spectra of the forbidden lines observed in our survey. Flux units are erg s−1 cm−2 Å−1. Red lines shows the Gaussian profiles of the individual fitted components, while the blue line shows the combined fitted Gaussians.
Current usage metrics show cumulative count of Article Views (full-text article views including HTML views, PDF and ePub downloads, according to the available data) and Abstracts Views on Vision4Press platform.
Data correspond to usage on the plateform after 2015. The current usage metrics is available 48-96 hours after online publication and is updated daily on week days.
Initial download of the metrics may take a while.