Fig. 13
Download original image
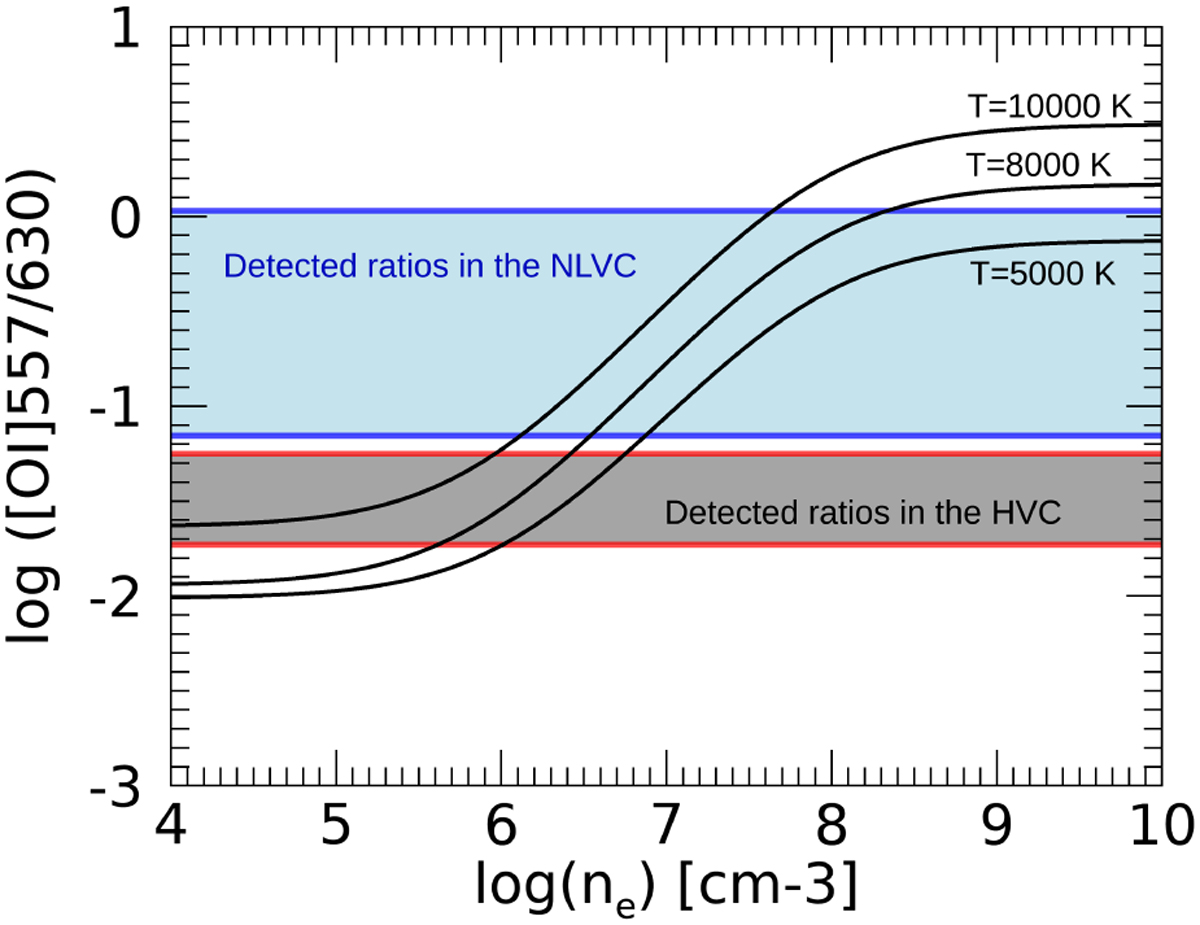
Slab model prediction for the [O I] 557 nm/[O I] 630 nm ratio for collisions with electrons. Solid lines refer to gas temperatures of 5, 8 and 10 × 103 K. The cyan area indicates the location of the range of values observed in the NLVC for the sub-sample of sources where the [O I] 557 nm line has been detected in this component. The grey area indicates instead the location of the detected ratios in the HVC.
Current usage metrics show cumulative count of Article Views (full-text article views including HTML views, PDF and ePub downloads, according to the available data) and Abstracts Views on Vision4Press platform.
Data correspond to usage on the plateform after 2015. The current usage metrics is available 48-96 hours after online publication and is updated daily on week days.
Initial download of the metrics may take a while.