Fig. 14
Download original image
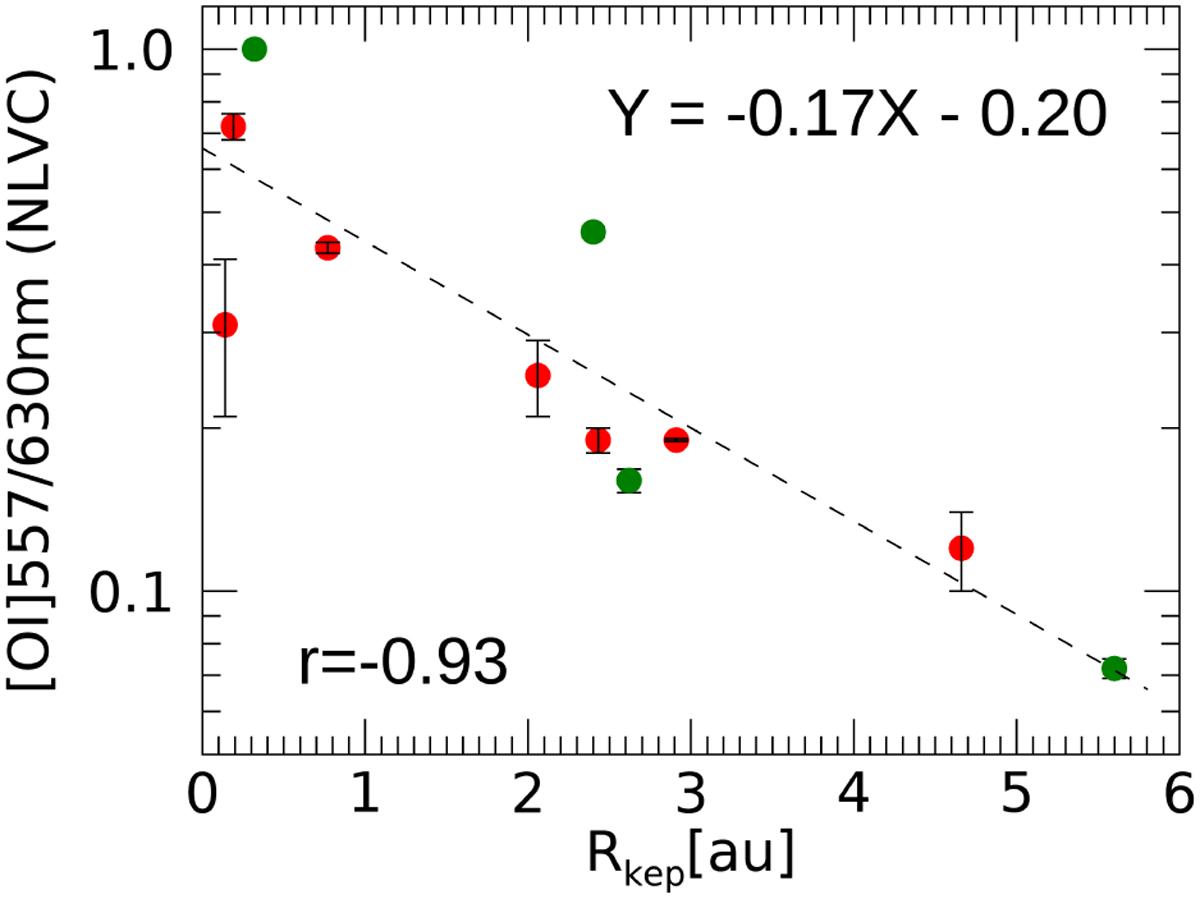
The [O I] 557 nm/[O I] 630 nm ratio observed in the NLVC with no velocity-shifted peak is plotted against the estimated [O I] 630 nm emission radius assuming Keplerian rotation. Green symbols indicate TD sources. The dashed line represents the linear fit through the points, whose analytical expression is indicated in the figure. The Pearson correlation coefficient is also displayed in the bottom right of the figure.
Current usage metrics show cumulative count of Article Views (full-text article views including HTML views, PDF and ePub downloads, according to the available data) and Abstracts Views on Vision4Press platform.
Data correspond to usage on the plateform after 2015. The current usage metrics is available 48-96 hours after online publication and is updated daily on week days.
Initial download of the metrics may take a while.