Fig. 15
Download original image
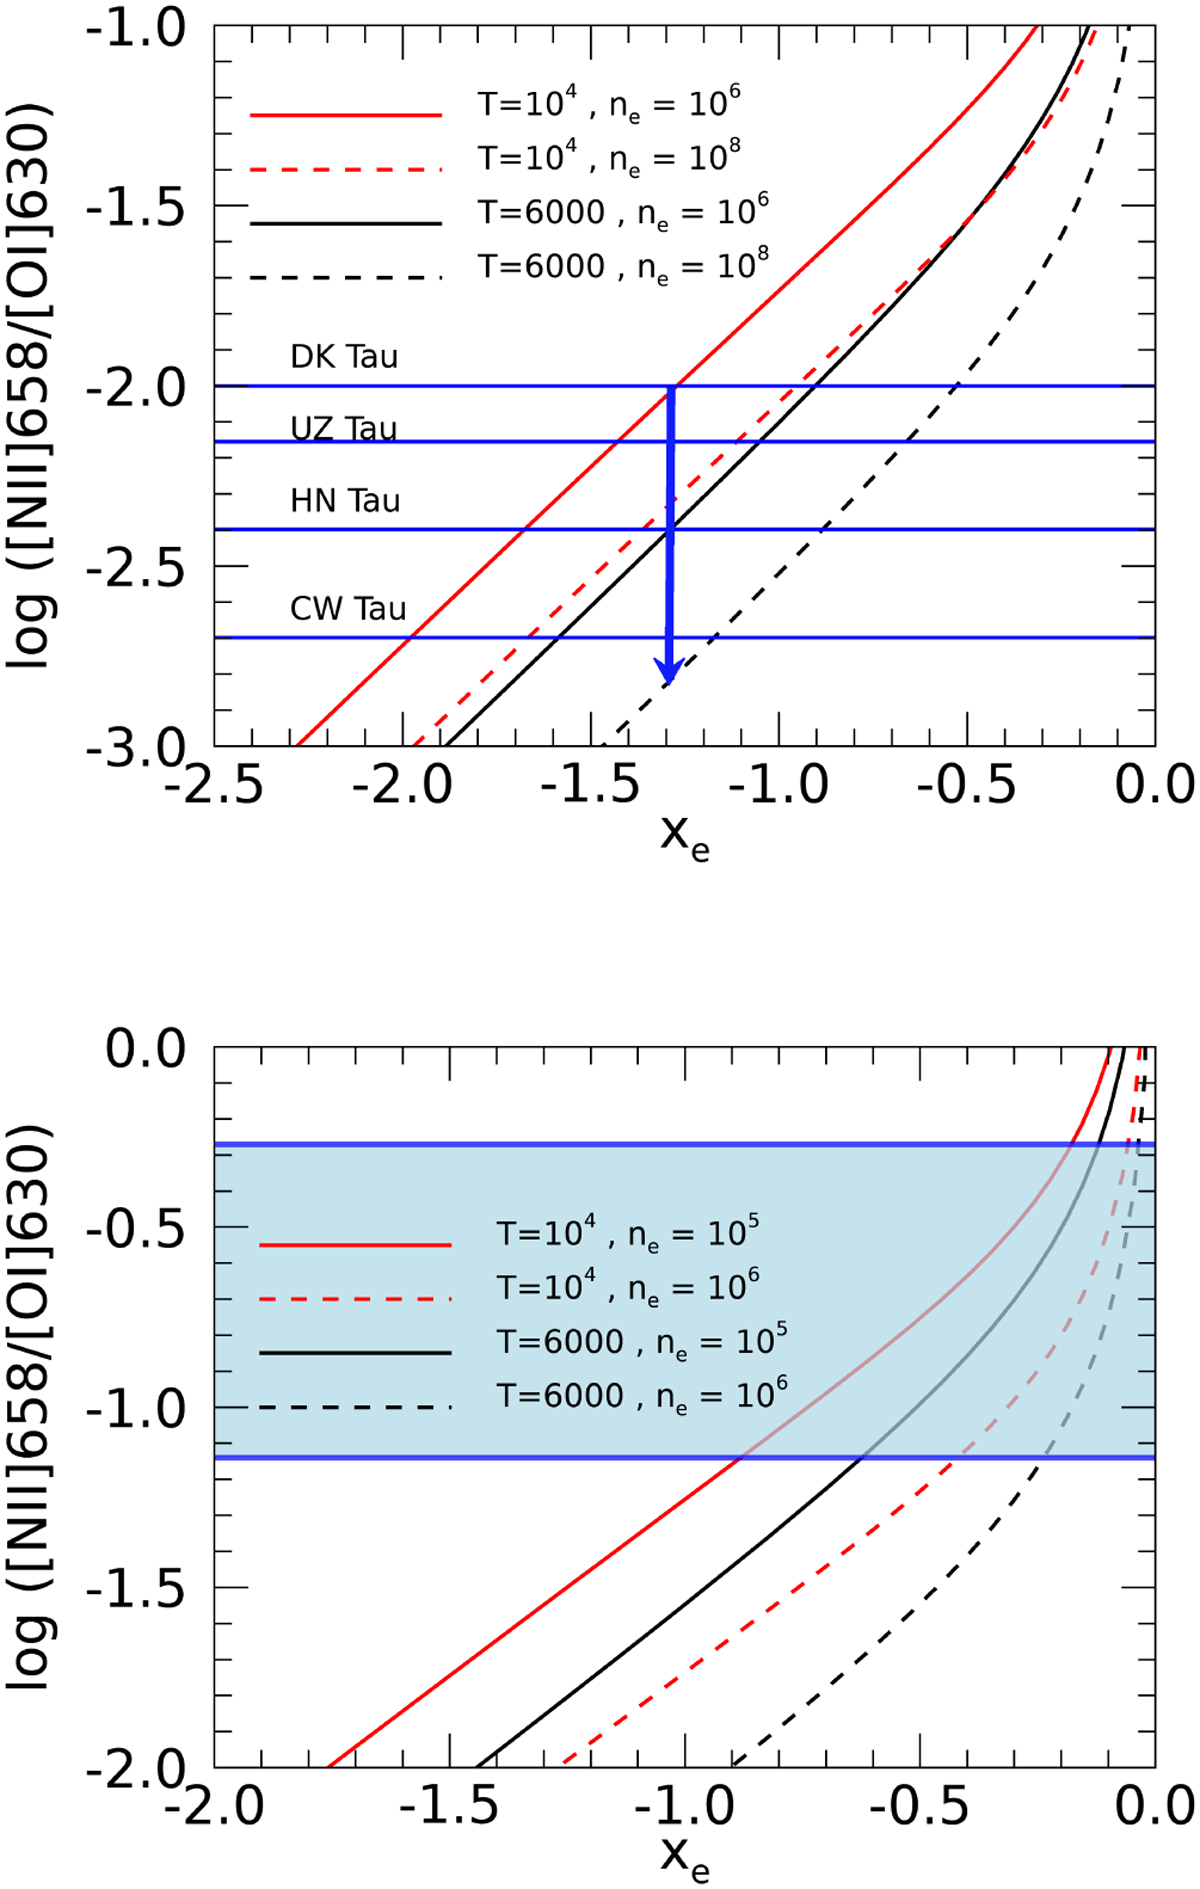
Ionization equilibrium model predictions for the [N II] 658 nm/[O I] 630 nm ratio for collisions with electrons, plotted as a function of the xe = ne/nH ratio. Different lines refer to different values of electron temperature and density as indicated in the legend. In the upper panel, horizontal lines indicate some of the more stringent upper limits of the [N II] 658 nm/[O I] 630 nm ratio in the NLVC, while in the lower panel the coloured region indicates the range of the [N II] 658 nm/[O I] 630 nm ratio observed in the HVC.
Current usage metrics show cumulative count of Article Views (full-text article views including HTML views, PDF and ePub downloads, according to the available data) and Abstracts Views on Vision4Press platform.
Data correspond to usage on the plateform after 2015. The current usage metrics is available 48-96 hours after online publication and is updated daily on week days.
Initial download of the metrics may take a while.