Fig. 6
Download original image
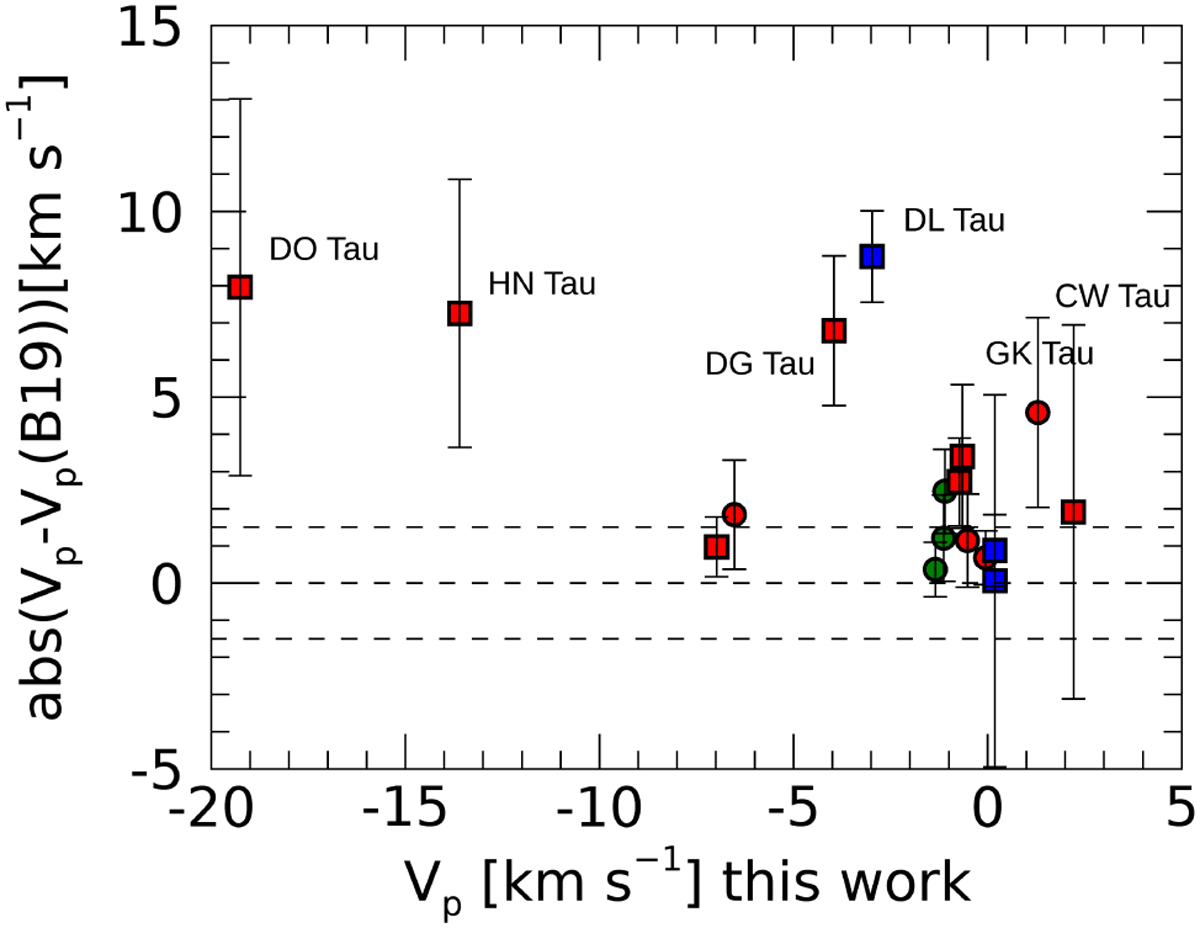
Difference between the peak velocity measured in this work (Vp) for the NLVC and that measured by Banzatti et al. (2019; Vp[B19]), plotted against Vp. The Vp of Banzatti et al. (2019) have been corrected by the slightly different adopted RV with respect to our work. The two dashed lines at ± 1.5 km s−1 indicate the velocity uncertainty of our measurements. Symbols colours refer to the disk type (red: full disks, blue: disk with sub-structures, green: TD) while squares indicate sources with a HVC.
Current usage metrics show cumulative count of Article Views (full-text article views including HTML views, PDF and ePub downloads, according to the available data) and Abstracts Views on Vision4Press platform.
Data correspond to usage on the plateform after 2015. The current usage metrics is available 48-96 hours after online publication and is updated daily on week days.
Initial download of the metrics may take a while.