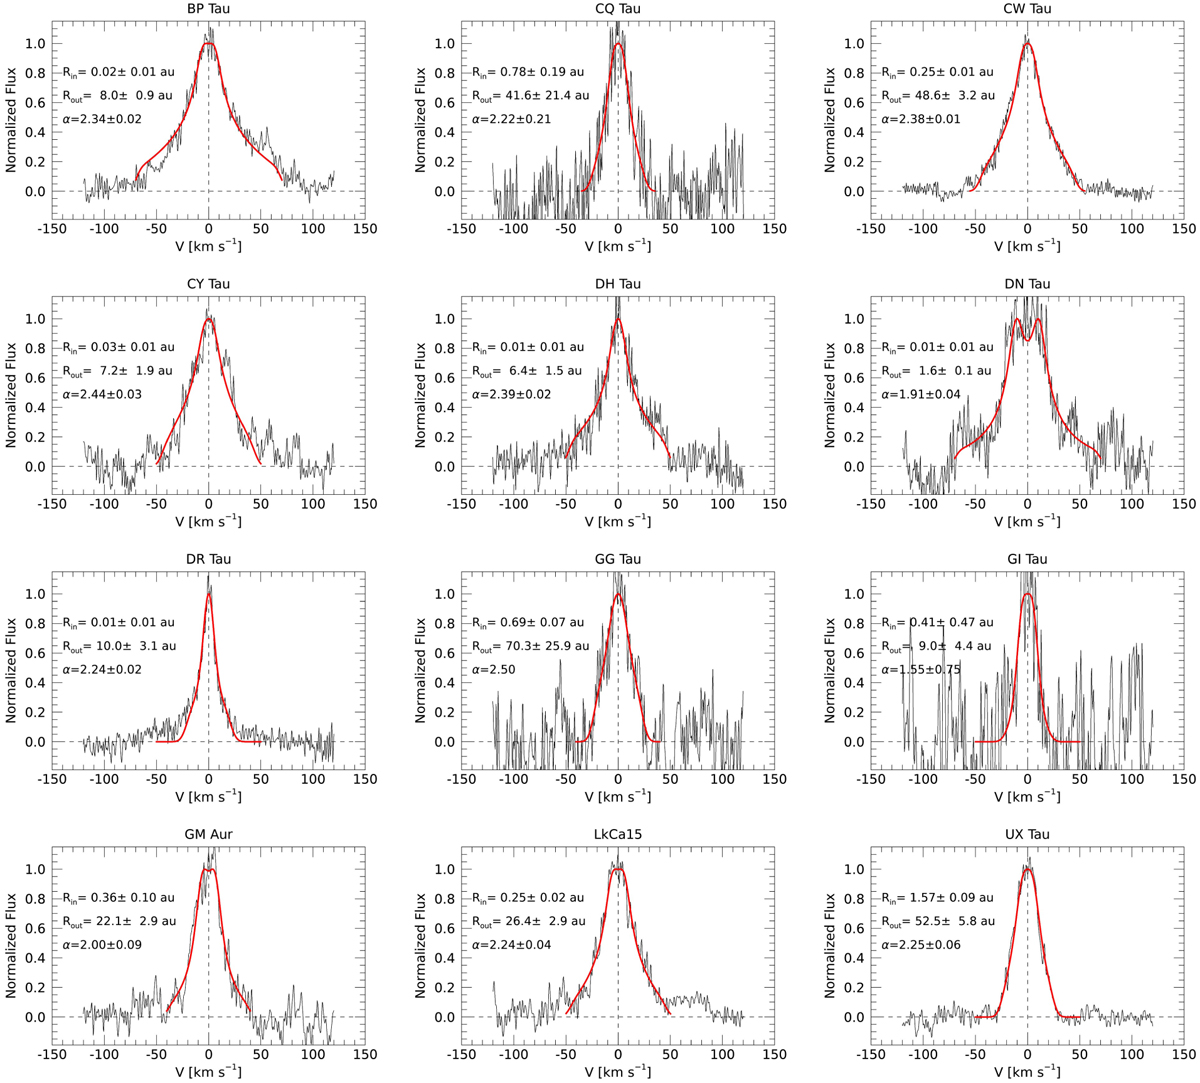
Fig. 8
Download original image
Comparison between the [O I] 630 nm line profiles having Vp close to zero, and a model of emission from a Keplerian disk. In the observed profiles the NLVC (or the NLVC+BLVC in the cases of Type 2 profiles) has been isolated by subtracting the Gaussian fit derived for the other components at different velocities. The fitted parameters of the model are indicated in each panel.
Current usage metrics show cumulative count of Article Views (full-text article views including HTML views, PDF and ePub downloads, according to the available data) and Abstracts Views on Vision4Press platform.
Data correspond to usage on the plateform after 2015. The current usage metrics is available 48-96 hours after online publication and is updated daily on week days.
Initial download of the metrics may take a while.