Open Access
Fig. 1.
Download original image
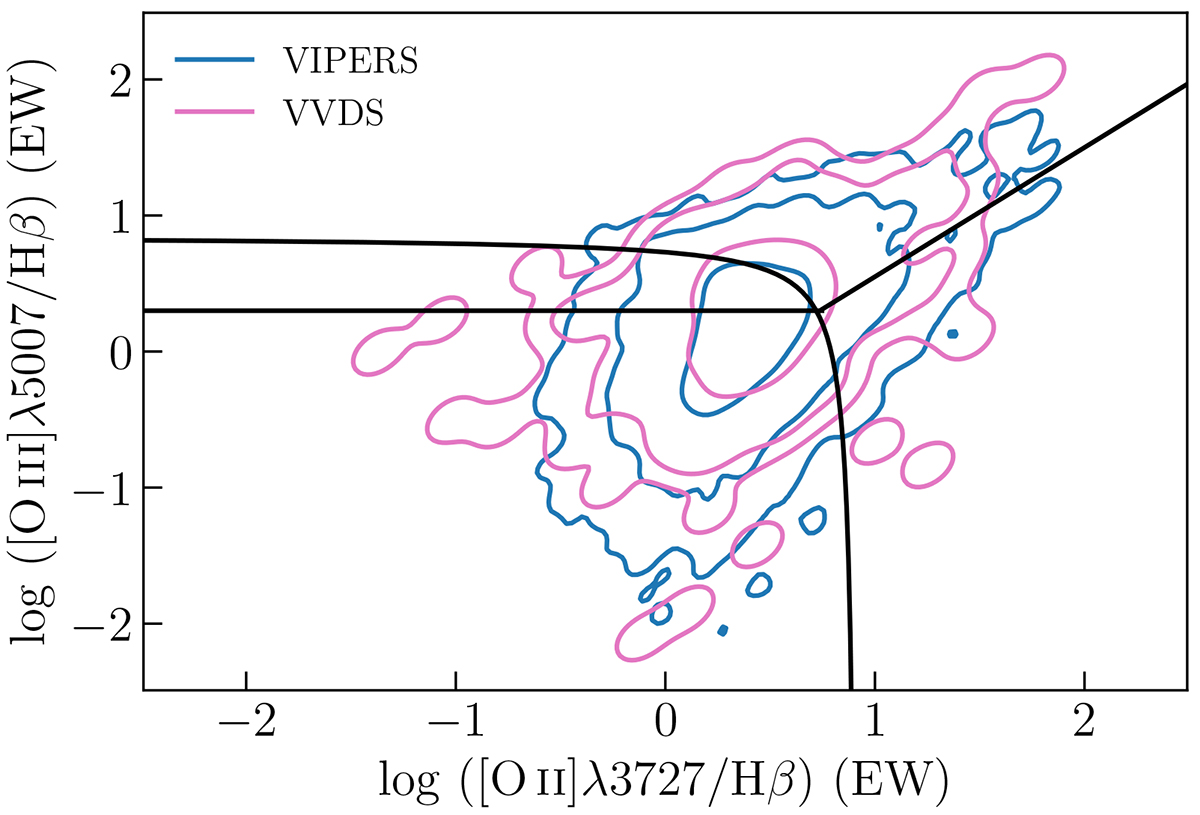
Blue BPT diagram (Lamareille 2010) for VIPERS (blue) and VVDS (pink) samples. Contours present 1, 2, and 3 standard-deviation levels of the distributions. The black lines are the thresholds defined in Lamareille (2010) to divide different galaxy types (SF, AGN, and LINERs).
Current usage metrics show cumulative count of Article Views (full-text article views including HTML views, PDF and ePub downloads, according to the available data) and Abstracts Views on Vision4Press platform.
Data correspond to usage on the plateform after 2015. The current usage metrics is available 48-96 hours after online publication and is updated daily on week days.
Initial download of the metrics may take a while.