Fig. 14.
Download original image
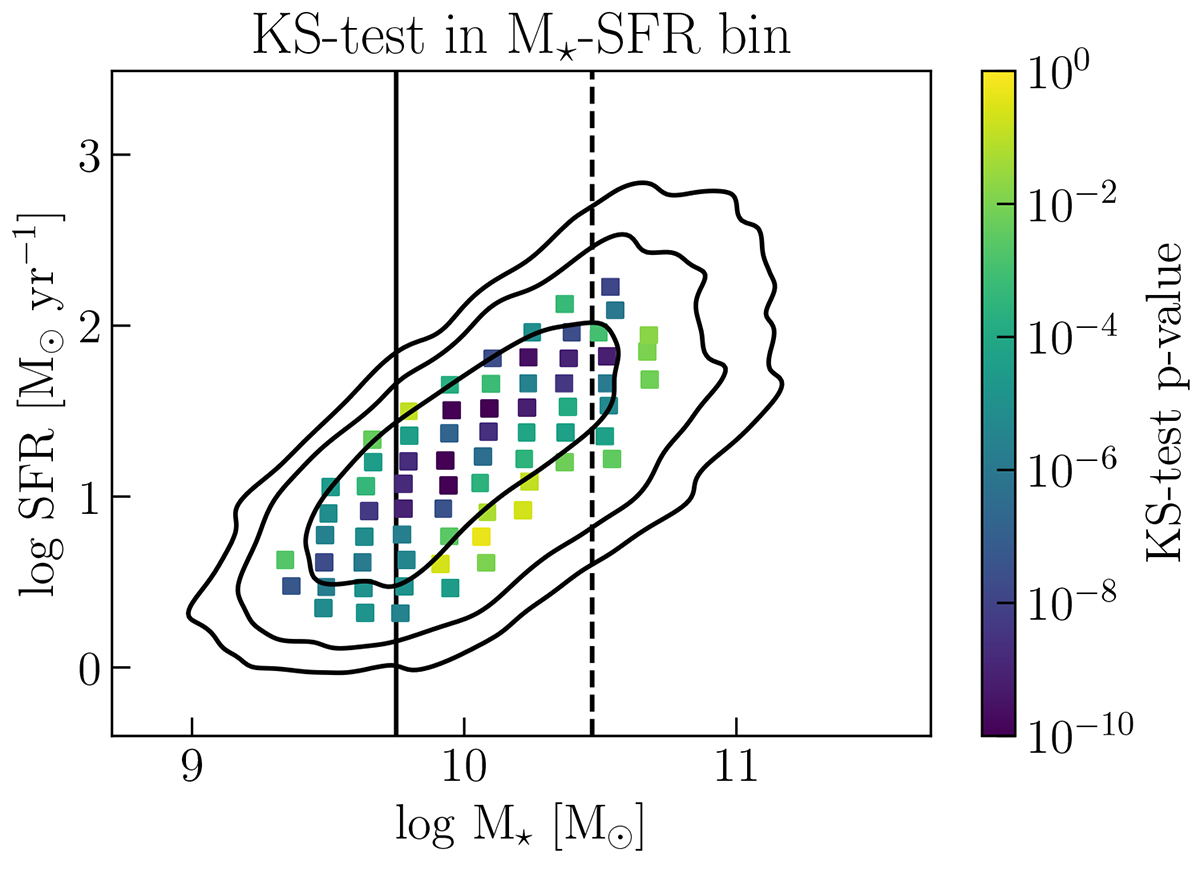
Results of KS-test between VIPERS and SDSS samples in order to check evolution of FMR. The scatter plot is color-coded according to the p value resulting from the KS test in M⋆-SFR bins. The color bar shows the two colors chosen above and below the threshold for the 95% confidence level of the KS test. The vertical black solid line indicates the mass below which the MZR at intermediate redshift flattens. The vertical black dashed line shows the most constrictive mass limit for completeness (log M⋆[M⊙] = 10.47 for 0.65 < z < = 0.8) in the redshift range observed by VIPERS (Davidzon et al. 2016).
Current usage metrics show cumulative count of Article Views (full-text article views including HTML views, PDF and ePub downloads, according to the available data) and Abstracts Views on Vision4Press platform.
Data correspond to usage on the plateform after 2015. The current usage metrics is available 48-96 hours after online publication and is updated daily on week days.
Initial download of the metrics may take a while.