Open Access
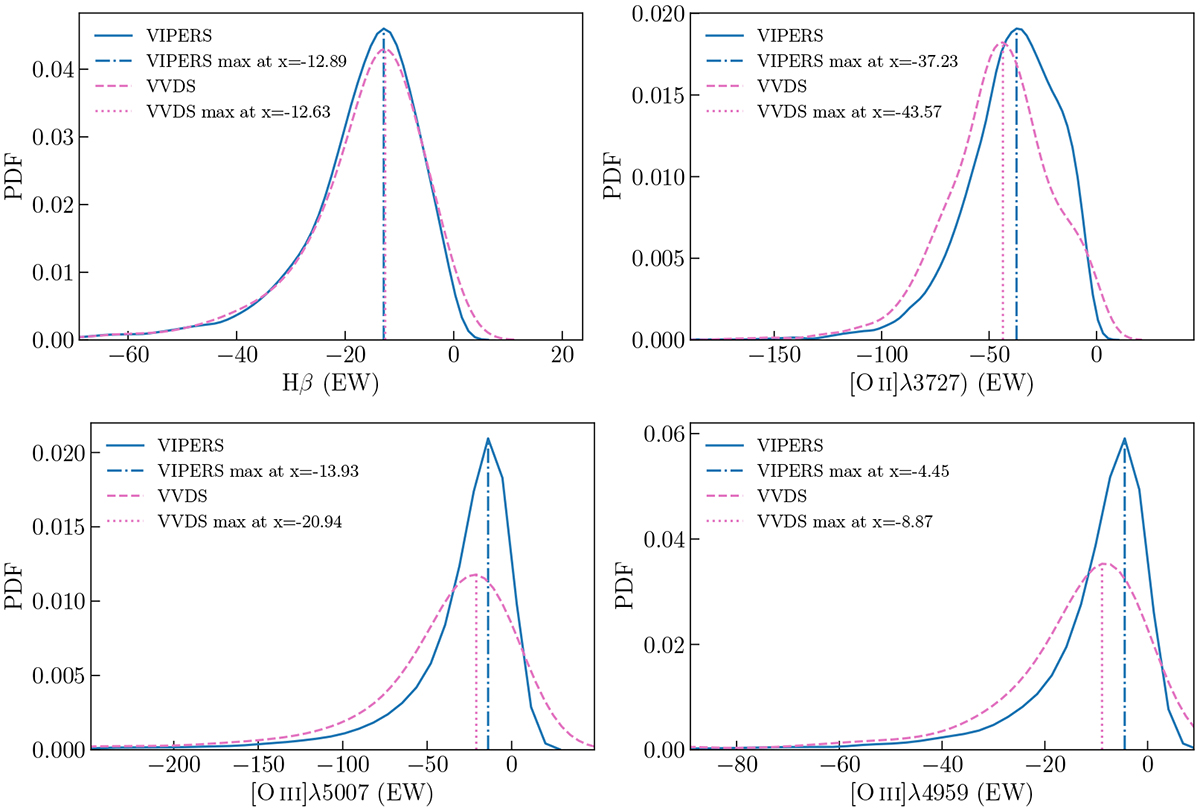
Fig. A.2.
Download original image
Comparison of EW distributions for Hβ (upper left), [O II]λ3727 (upper right), [O III]λ5007 (bottom left), and [O III]λ4959 (bottom right) lines between VIPERS (blue solid line) and VVDS (pink dashed line) samples. In the same plot, the position of the maximum of each distribution is highlighted.
Current usage metrics show cumulative count of Article Views (full-text article views including HTML views, PDF and ePub downloads, according to the available data) and Abstracts Views on Vision4Press platform.
Data correspond to usage on the plateform after 2015. The current usage metrics is available 48-96 hours after online publication and is updated daily on week days.
Initial download of the metrics may take a while.