Fig. 13
Download original image
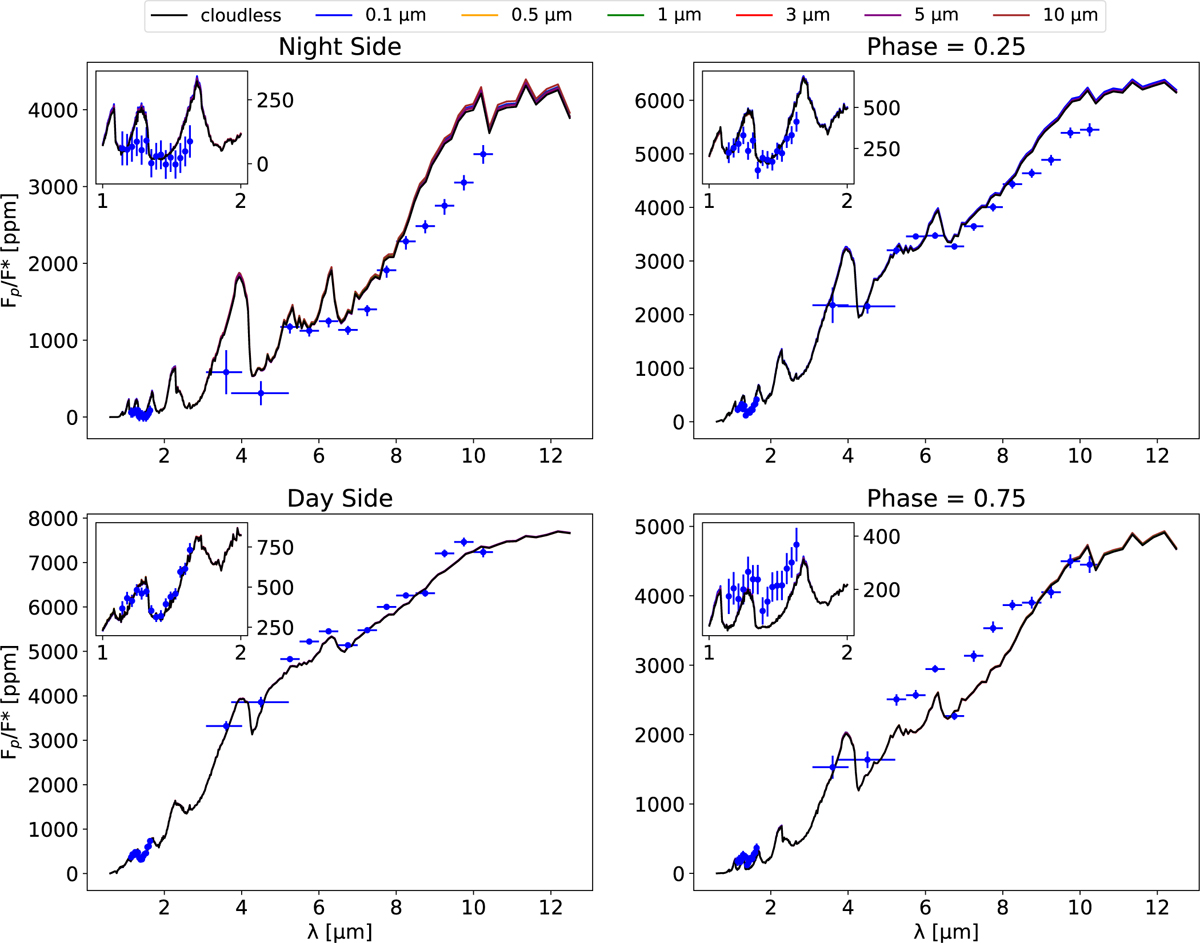
Spectral phase curves of WASP-43 b at four given phases, from 0.6 to 12.5 μm, for a super-solar metallicity atmosphere. The black line is the cloudless simulation. Each colour corresponds to a simulation with a different cloud particle size. Each coloured line is a simulation with Mg2SiO4 clouds and a different radius. Blue data points and error bars from HST are taken from Table 5 of Stevenson et al. (2017). Spitzer data point are from Morello et al. (2019), and MIRI-LRS data points are from the Eureka! v2 Reduction, as explained above. In each panel, the subplot is a zoomed-in view of the HST data, between 1.1 and 1.7 μm. Dayside corresponds to the planet passing behind its star and nightside to the planet passing in front of its star. The 0.25 phase is the quarter phase between the night and day phases, and the 0.75 phase is the quarter phase between the day and night phases. Thus, the eastern terminator is seen at phase 0.25 and the western terminator at phase 0.75.
Current usage metrics show cumulative count of Article Views (full-text article views including HTML views, PDF and ePub downloads, according to the available data) and Abstracts Views on Vision4Press platform.
Data correspond to usage on the plateform after 2015. The current usage metrics is available 48-96 hours after online publication and is updated daily on week days.
Initial download of the metrics may take a while.