Fig. 14
Download original image
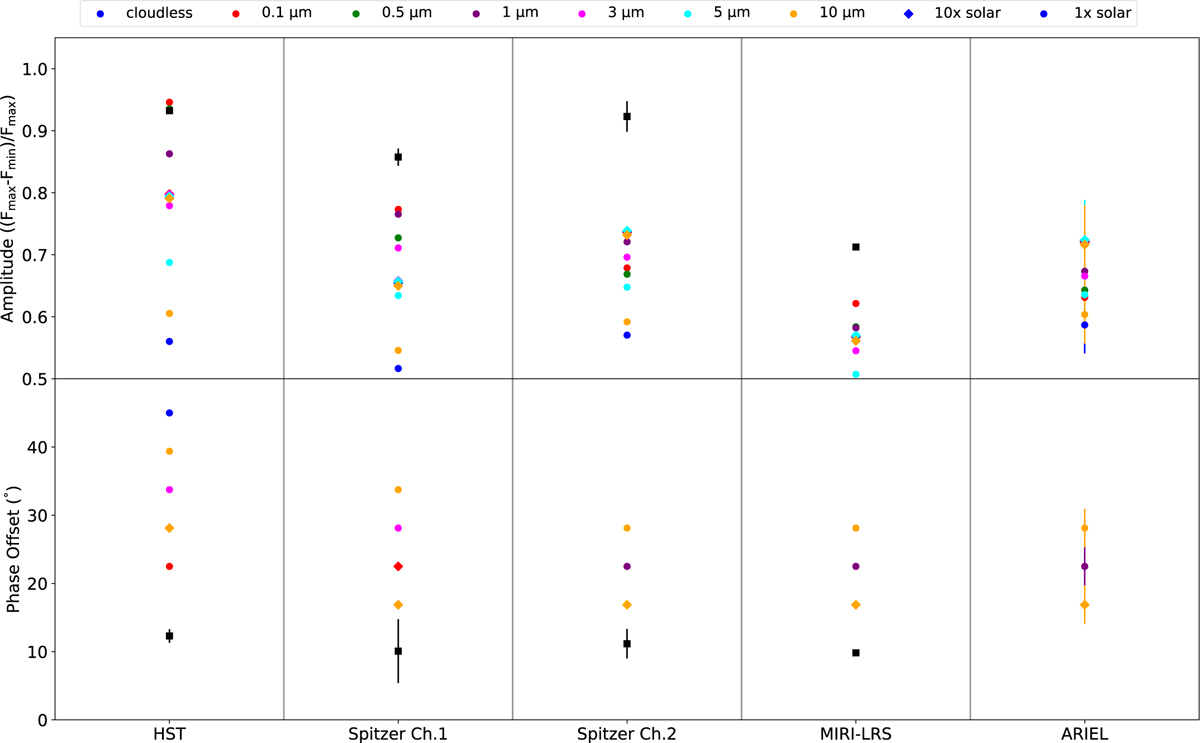
Amplitude and offset of the simulated broadband phase curves in the HST, Spitzer, and MIRI-LRS bands. Predictions for the amplitude and offset in Ariel s band is also added to the plots. The black square represents data points from Stevenson et al. (2014) and Morello et al. (2019), or our MIRI-LRS reduction. Each colour is associated with a cloudy or cloud-free scenario. Circles represent the solar metallicity simulations and diamonds the 10× solar metallicity simulations.
Current usage metrics show cumulative count of Article Views (full-text article views including HTML views, PDF and ePub downloads, according to the available data) and Abstracts Views on Vision4Press platform.
Data correspond to usage on the plateform after 2015. The current usage metrics is available 48-96 hours after online publication and is updated daily on week days.
Initial download of the metrics may take a while.