Fig. B.2
Download original image
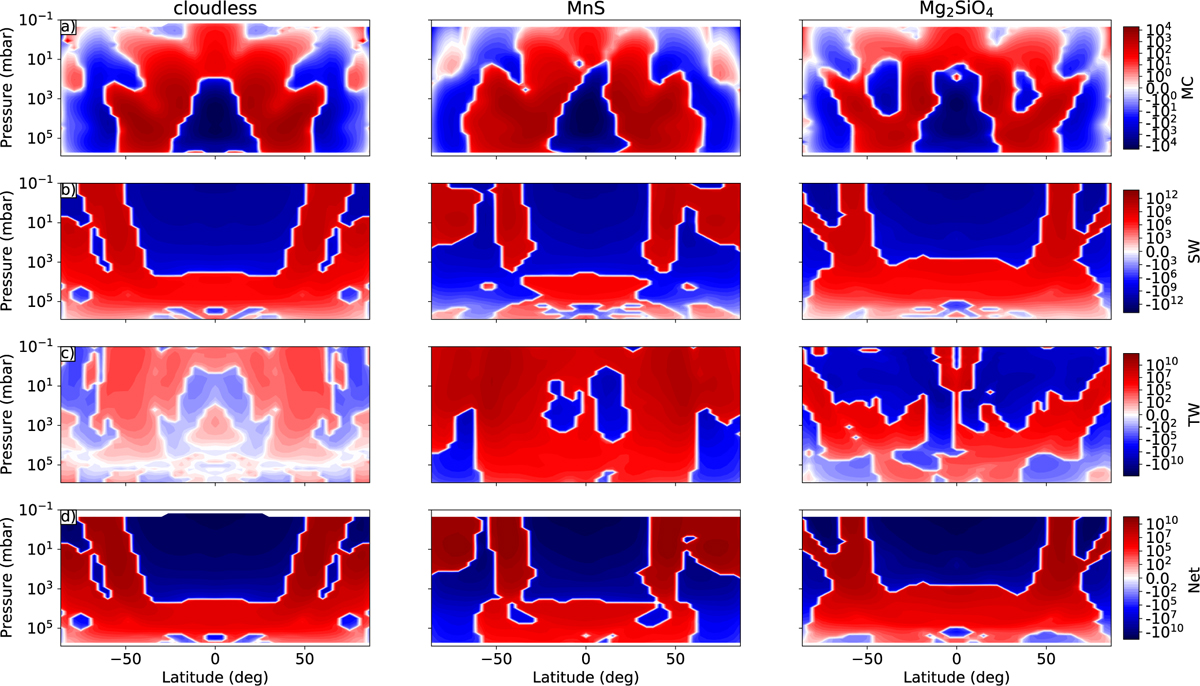
Axial angular momentum vertical transport for the cloudless simulation of WASP-43 b (left) and 1 um clouds of MnS (middle) and Mg2SiO4 (right). Each row displays a different contribution: mean circulation contribution (a), stationary wave contribution (b), transient wave contribution (c), and net transport (d). Each row is plotted with a different range to show the amplitude of each contribution to the net transport.
Current usage metrics show cumulative count of Article Views (full-text article views including HTML views, PDF and ePub downloads, according to the available data) and Abstracts Views on Vision4Press platform.
Data correspond to usage on the plateform after 2015. The current usage metrics is available 48-96 hours after online publication and is updated daily on week days.
Initial download of the metrics may take a while.