Fig. 2
Download original image
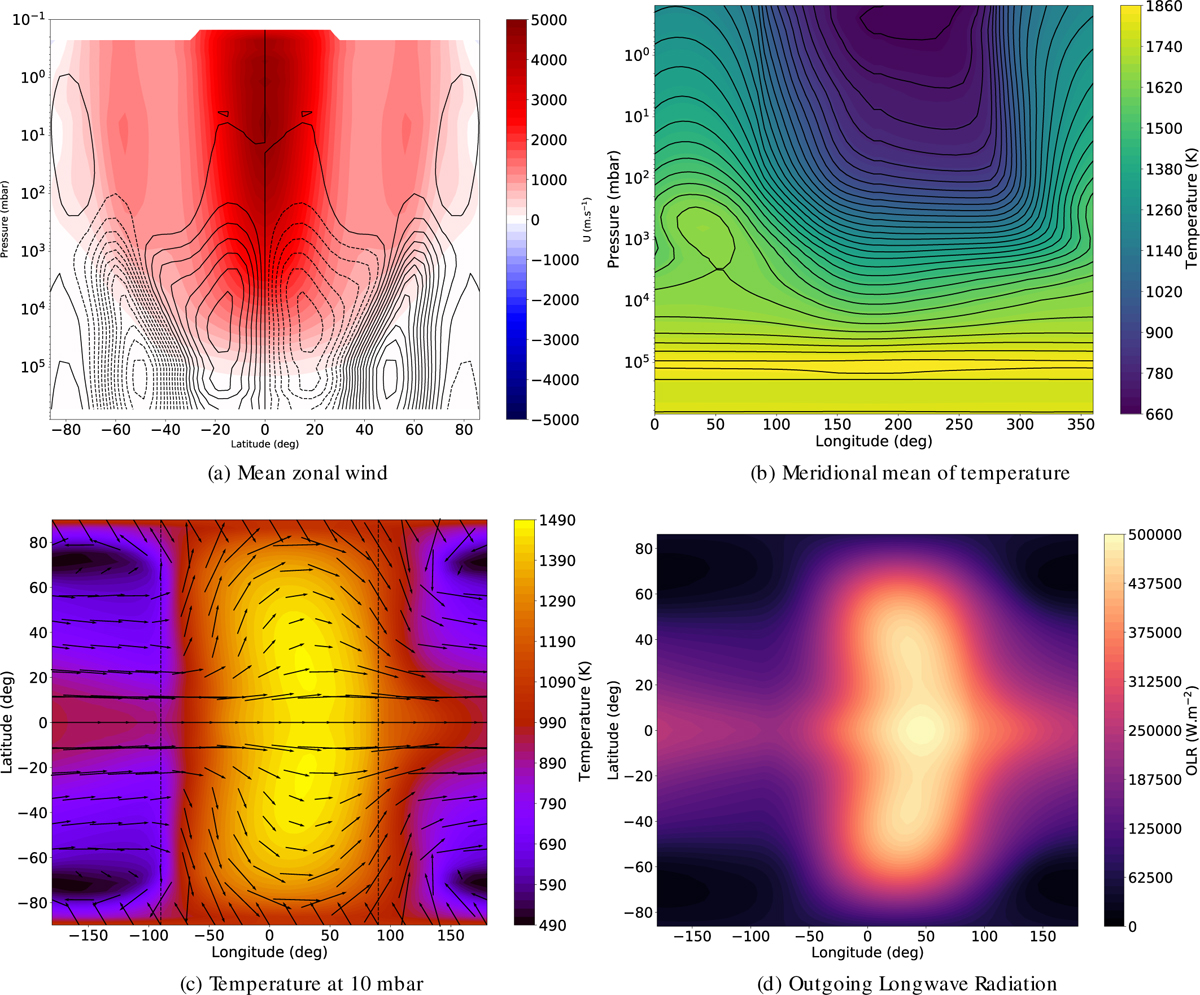
Broad dynamical features and outgoing thermal flux for the cloudless simulation of WASP-43 b. (a) Zonal mean and time-averaged zonal wind. The stream functions are plotted in black, with dashed lines representing an anti-clockwise circulation and solid lines a clockwise circulation. (b) Temperature map averaged in time and in latitude. Solid lines are contours corresponding to the colour bar, highlighting the eastward shift of the hotspot. (c) Longitude-latitude temperature map at 10 mbar, averaged in time. Black arrows show the time-averaged wind direction, with the size of the arrow proportional to the magnitude of the wind. Vertical dashed black lines are the two terminators, delimiting the day and the nightside of the planet. (d) OLR map, averaged in time.
Current usage metrics show cumulative count of Article Views (full-text article views including HTML views, PDF and ePub downloads, according to the available data) and Abstracts Views on Vision4Press platform.
Data correspond to usage on the plateform after 2015. The current usage metrics is available 48-96 hours after online publication and is updated daily on week days.
Initial download of the metrics may take a while.