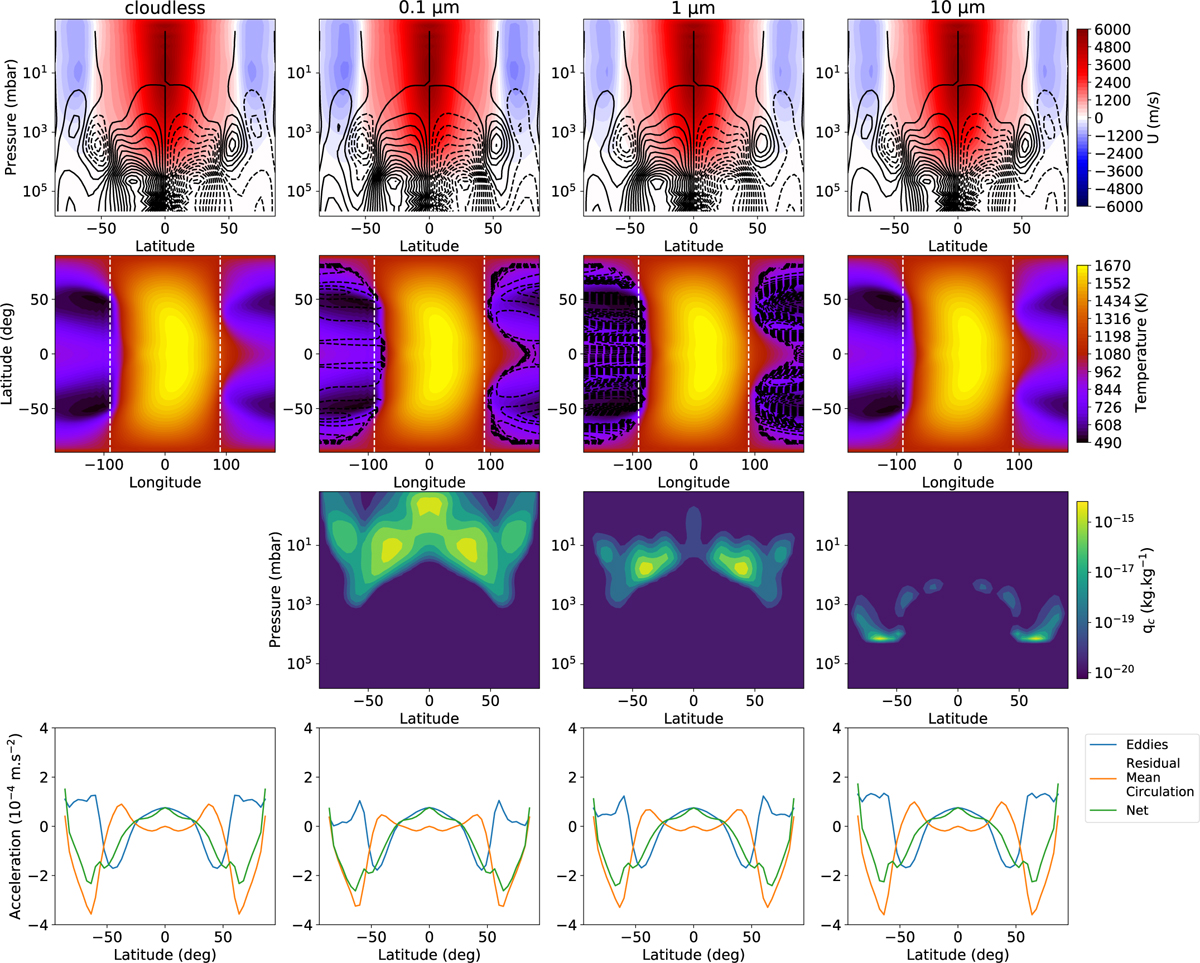
Fig. C.2
Download original image
Comparison of wind patterns, temperature maps at 10 mbar, cloud latitudinal distributions, and jet acceleration for simulations with Mg2SiO4 clouds at super-solar metallicity and particle sizes of 0.1, 1, and 10 μm. The first column is the cloudless simulation, and the following are the cloudy ones. Top row: Zonal mean and time-averaged zonal wind. Black contours are the mass stream function, with solid lines indicating a clockwise circulation and dashed lines an anti-clockwise circulation. Second row: Time-averaged temperature map at the 10 mbar isobaric level. Black contours denote the location of clouds. White vertical dashed lines are the terminators. Third row: Latitude-pressure map of the cloud distribution, averaged in time and longitude. Bottom panel: Vertically integrated jet zonal wind acceleration in zonal and time mean between 5 and 20 mbar. We show the decomposition into residual mean circulation, the eddy contributions, and the net acceleration.
Current usage metrics show cumulative count of Article Views (full-text article views including HTML views, PDF and ePub downloads, according to the available data) and Abstracts Views on Vision4Press platform.
Data correspond to usage on the plateform after 2015. The current usage metrics is available 48-96 hours after online publication and is updated daily on week days.
Initial download of the metrics may take a while.