Fig. 3
Download original image
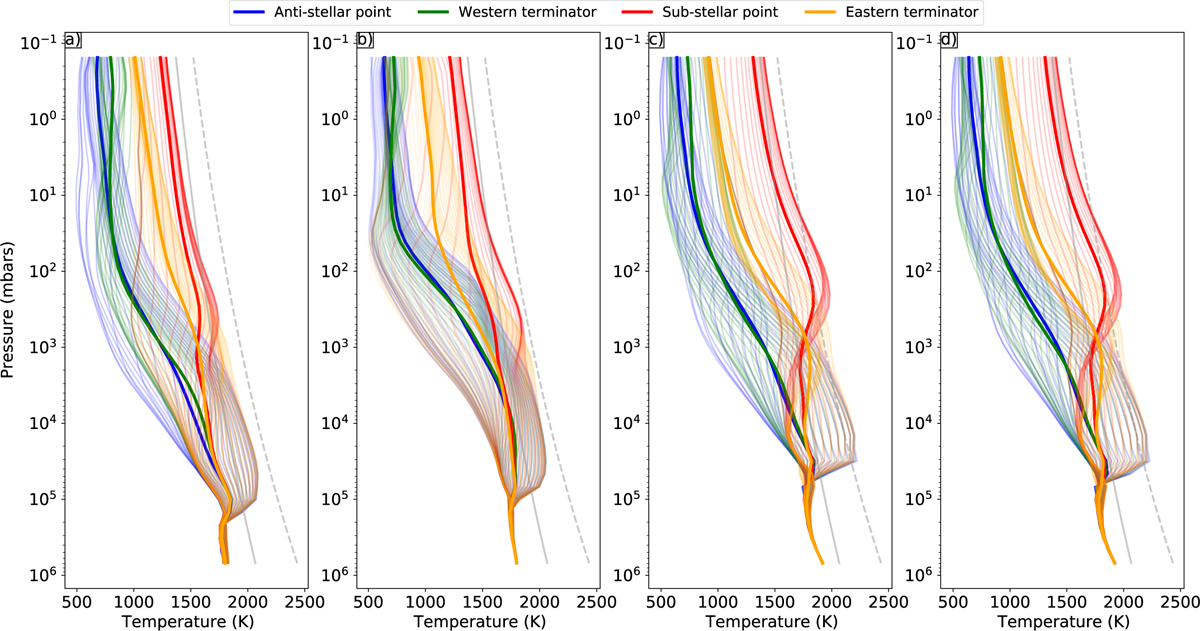
Modelled temperature profiles at different longitudes, averaged in latitude (thick lines). The light lines represent the temperature profiles at each latitude (spaced every 3.75°). (a) Cloudless simulation at solar metallicity. (b) With Mg2SiO4 clouds of 1 μm at solar metallicity. (c) Cloudless at 10× solar metallicity. (d) With Mg2SiO4 clouds of 1 μm at 10x solar metallicity. The solid grey line represents the condensation curves of Mg2SiO4 at solar metallicity, and the dashed grey line is the condensation curve of Mg2SiO4 at 10× solar metallicity.
Current usage metrics show cumulative count of Article Views (full-text article views including HTML views, PDF and ePub downloads, according to the available data) and Abstracts Views on Vision4Press platform.
Data correspond to usage on the plateform after 2015. The current usage metrics is available 48-96 hours after online publication and is updated daily on week days.
Initial download of the metrics may take a while.