Open Access
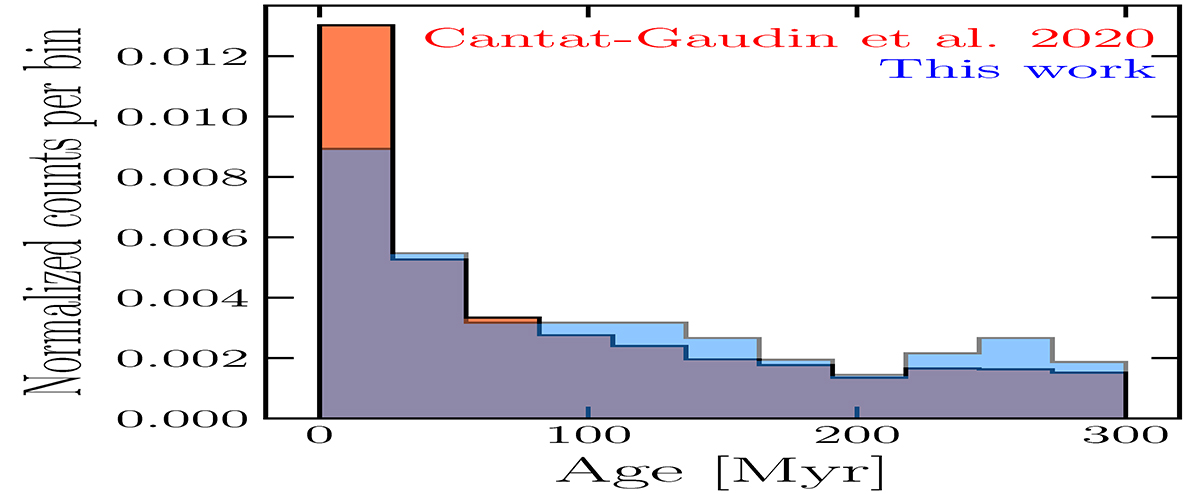
Fig. 3.
Download original image
Age distributions for clusters in the starting catalog (in red, Cantat-Gaudin et al. 2020) and those retained in the kinematic analysis (in blue). Histograms were normalized such that their areas sum to unity.
Current usage metrics show cumulative count of Article Views (full-text article views including HTML views, PDF and ePub downloads, according to the available data) and Abstracts Views on Vision4Press platform.
Data correspond to usage on the plateform after 2015. The current usage metrics is available 48-96 hours after online publication and is updated daily on week days.
Initial download of the metrics may take a while.