Fig. 12
Download original image
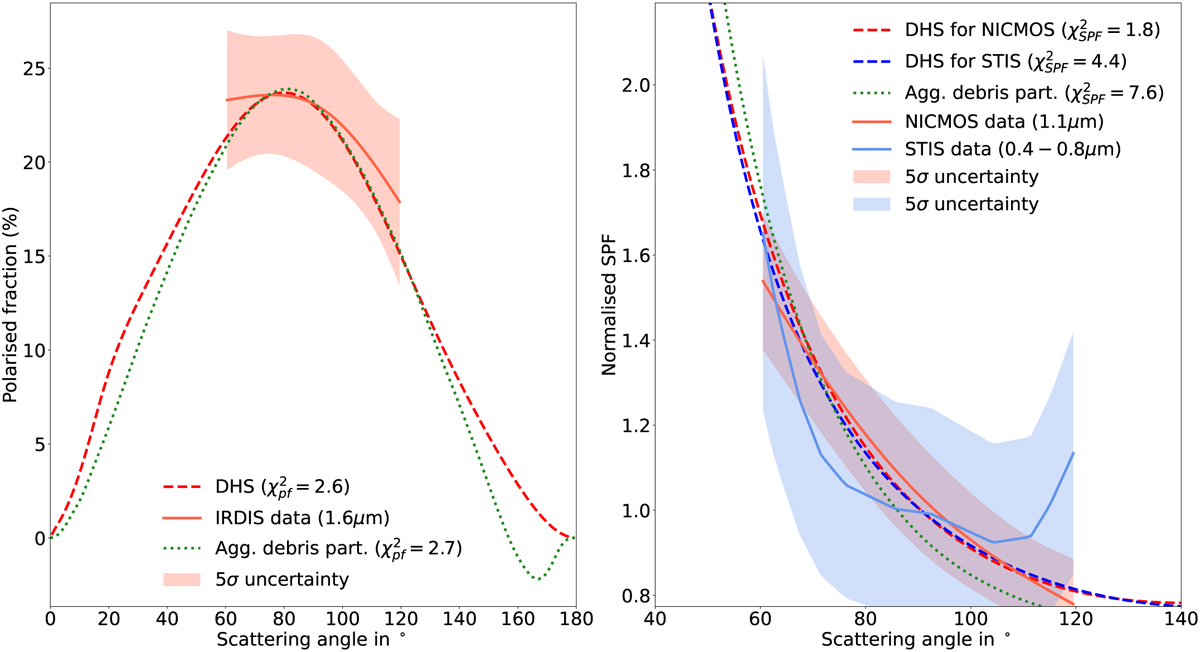
Comparison of the best model among the grid detailed in Table 5 (dashed line) with the IRDIS polarised fraction (left, plain red line) and the NICMOS total intensity SPF (right, plain red line). This model provides the smallest reduced ![]() of 4.4. The STIS total intensity SPF from Stark et al. (2014) is also shown (right, plain blue line) and compared with the model prediction at the STIS wavelengths (dashed blue line). The two panels also show in green dotted lines one model of aggregated debris particle from Zubko et al. (2009), matching well the polarised fraction but slightly less the total intensity SPF. This model employs 40% of the transparent material 1.6 + 0.001i and 60% of more absorbing material 2.43 + 0.59i in a size distribution parameterised with v = −2.3, and provides a reduced
of 4.4. The STIS total intensity SPF from Stark et al. (2014) is also shown (right, plain blue line) and compared with the model prediction at the STIS wavelengths (dashed blue line). The two panels also show in green dotted lines one model of aggregated debris particle from Zubko et al. (2009), matching well the polarised fraction but slightly less the total intensity SPF. This model employs 40% of the transparent material 1.6 + 0.001i and 60% of more absorbing material 2.43 + 0.59i in a size distribution parameterised with v = −2.3, and provides a reduced ![]() of 10.3.
of 10.3.
Current usage metrics show cumulative count of Article Views (full-text article views including HTML views, PDF and ePub downloads, according to the available data) and Abstracts Views on Vision4Press platform.
Data correspond to usage on the plateform after 2015. The current usage metrics is available 48-96 hours after online publication and is updated daily on week days.
Initial download of the metrics may take a while.