Fig. 4
Download original image
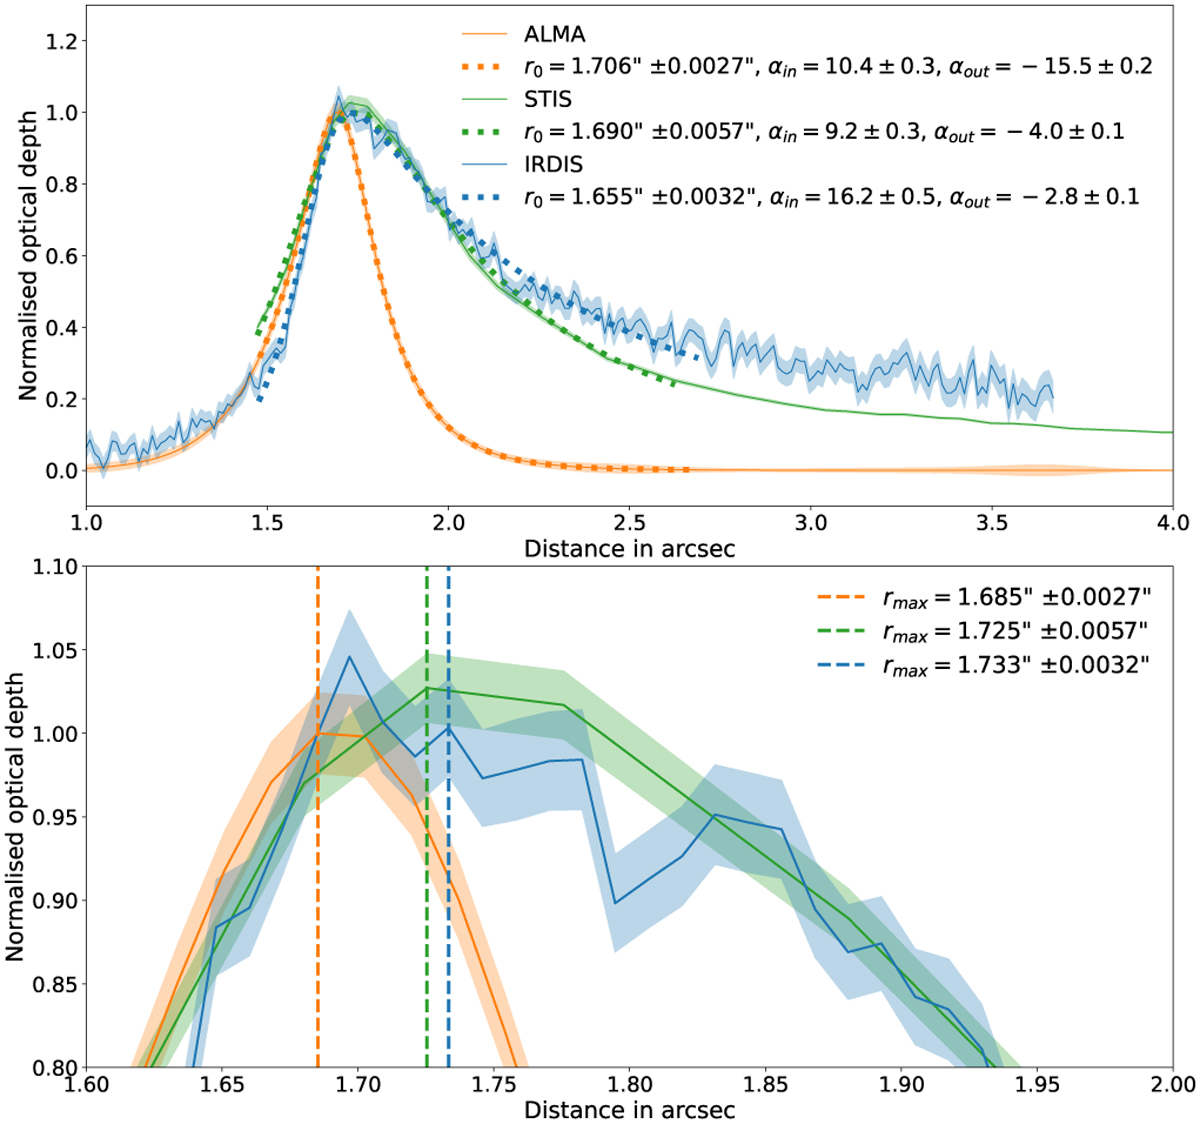
Deprojected normalised optical depth of the disk at mm wavelengths (orange line extracted from data published in Pawellek et al. 2021), in the optical with STIS (green line Stark et al. 2014, assuming a 2% uncertainty), and in the near-infrared with IRDIS (blue line). The top panel shows the data (plain lines) with the 1σ uncertainty (shade) and the double-power law fit (dotted line limited to the range of separation where the fit was performed). The bottom panel is a zoom in the region where the optical depth peaks, highlighting with vertical dotted line the location of the maxima.
Current usage metrics show cumulative count of Article Views (full-text article views including HTML views, PDF and ePub downloads, according to the available data) and Abstracts Views on Vision4Press platform.
Data correspond to usage on the plateform after 2015. The current usage metrics is available 48-96 hours after online publication and is updated daily on week days.
Initial download of the metrics may take a while.