Fig. 3.

Download original image
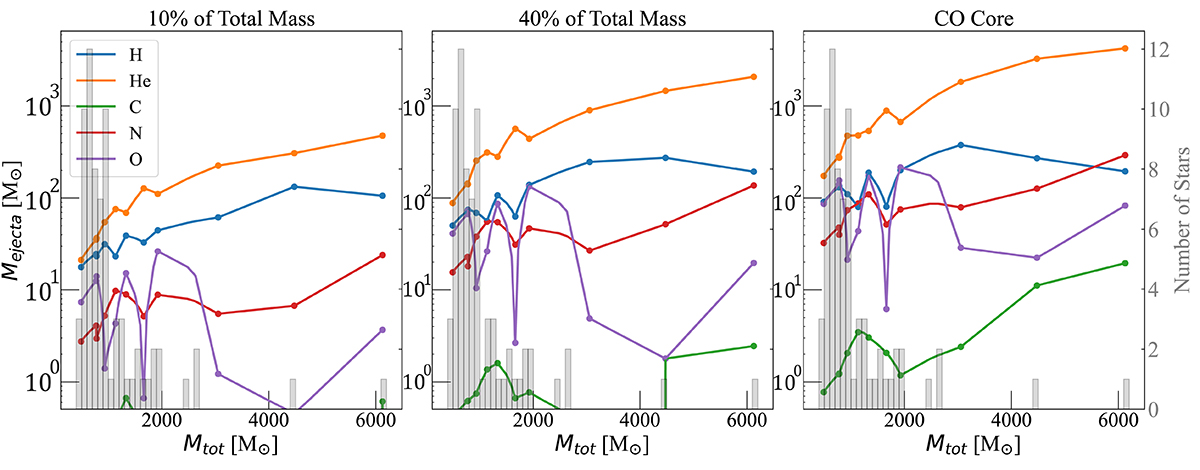
Mass ejected of various chemical species by each individual star in the halo from Regan et al. (2020a). The first y-axis with lines and dots shows the ejected masses in M⊙ for a given element for all the individual stars in the simulation of Regan et al. (2020a). The dots connect the interpolated values between the 11 computed models and each dot on lines correspond to the 11 models computed until the end of core Helium burning. The second y-axis represents the number of stars in the histogram only. The bins in the histogram cover a width of 100 M⊙ starting from 40 M⊙ and ending at 6200 M⊙. The left panel shows the case when 10% of the total mass is ejected. The middle and right panel, the cases when 40%, and respectively the whole mass above the CO core is ejected.
Current usage metrics show cumulative count of Article Views (full-text article views including HTML views, PDF and ePub downloads, according to the available data) and Abstracts Views on Vision4Press platform.
Data correspond to usage on the plateform after 2015. The current usage metrics is available 48-96 hours after online publication and is updated daily on week days.
Initial download of the metrics may take a while.


