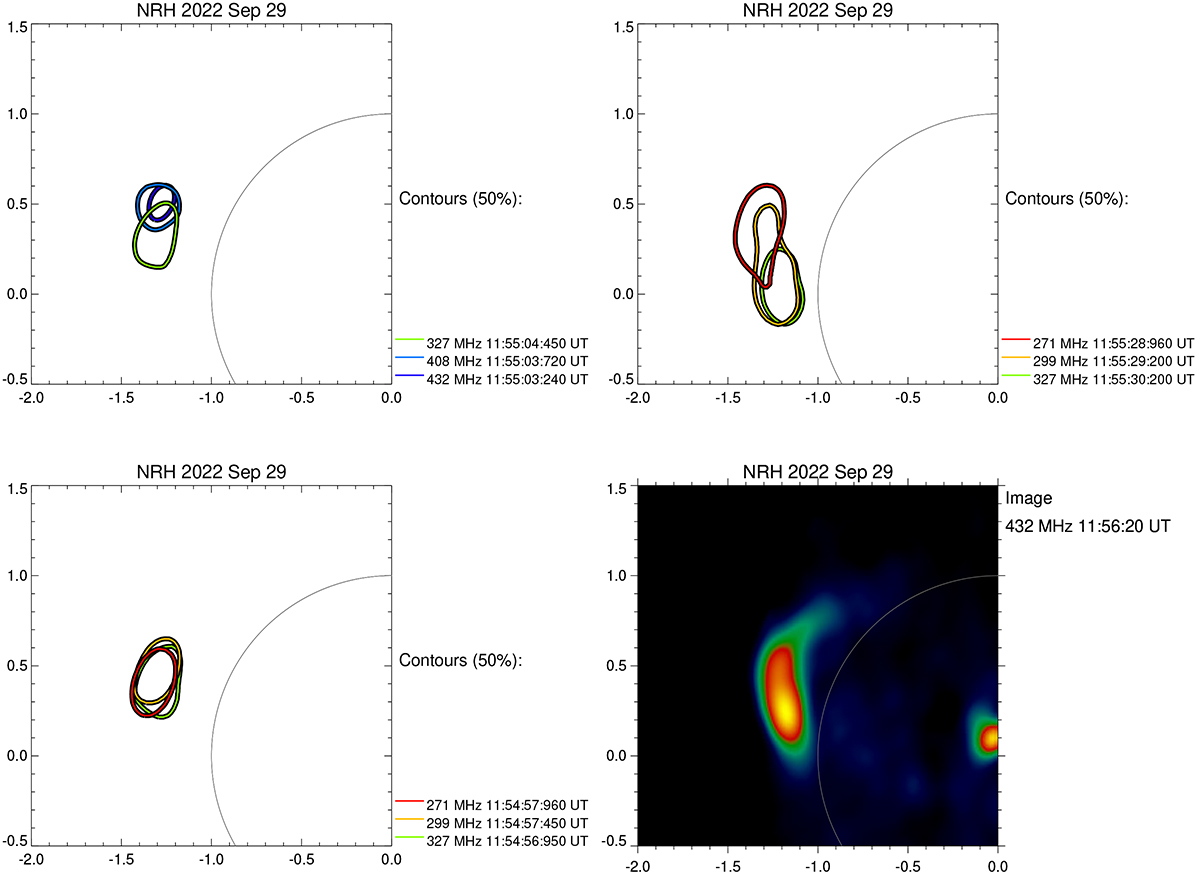
Fig. 5.
Download original image
NRH maps during selected periods of the event. Top left: Isointensity contours at half maximum during the type J burst at 11:55:03 UT (rectangle 1 in Fig. 4). Top right: Reverse-drifting burst near 11:55:30 UT (rectangle 2). Bottom left: Type J burst at 11:54:57 UT on the low-frequency side of the red spectral dividing line (rectangle 3). Bottom right: Image of the continuum source at 432 MHz (average 11:56:20–11:56:50 UT).
Current usage metrics show cumulative count of Article Views (full-text article views including HTML views, PDF and ePub downloads, according to the available data) and Abstracts Views on Vision4Press platform.
Data correspond to usage on the plateform after 2015. The current usage metrics is available 48-96 hours after online publication and is updated daily on week days.
Initial download of the metrics may take a while.