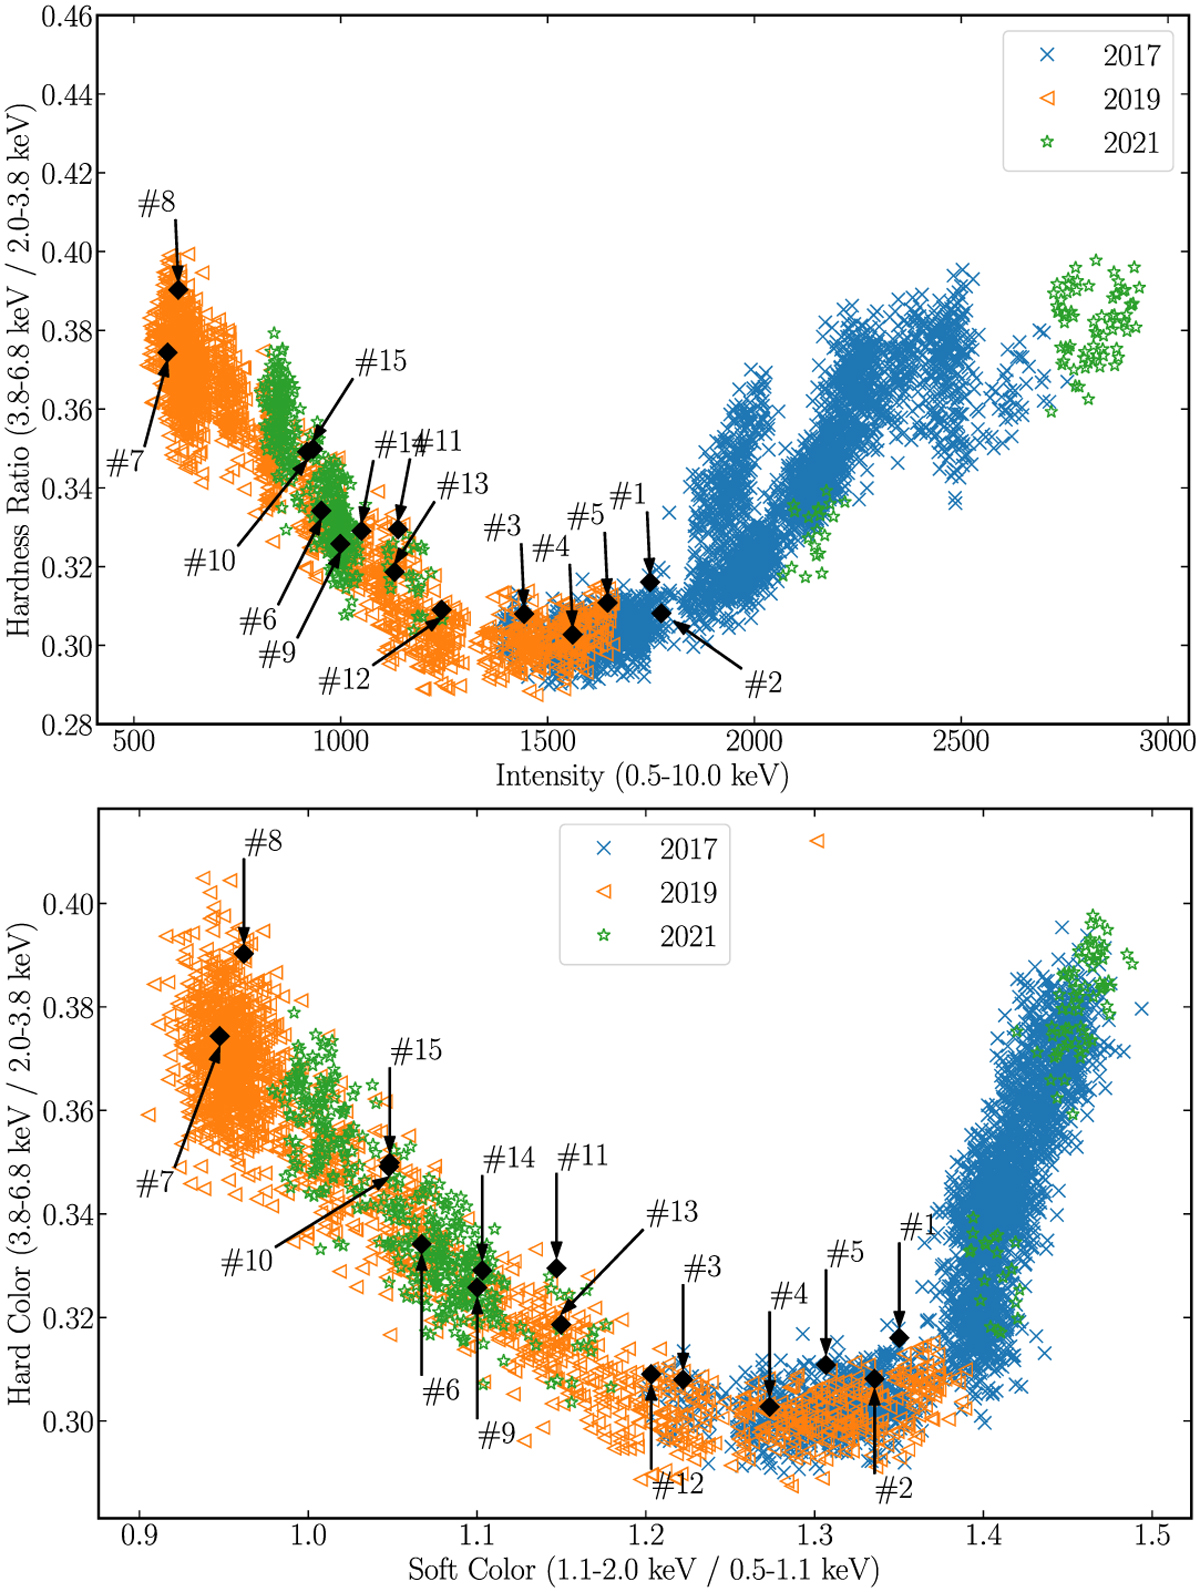
Fig. 2
Download original image
Hardness-intensity diagram (HID, top panel) and color–color diagram (CCD, bottom panel) of 4U 1820–30 from the NICER observations. The blue crosses, orange triangles, and green stars represent the data observed in 2017, 2019, and 2021, respectively. All bursts are removed, and each point represents a segment of 64 s. The HID and CCD of the persistent emission before each X-ray burst are shown as filled black diamonds. For each panel, from left to right, the spectra evolved from the hard island state to the soft banana state.
Current usage metrics show cumulative count of Article Views (full-text article views including HTML views, PDF and ePub downloads, according to the available data) and Abstracts Views on Vision4Press platform.
Data correspond to usage on the plateform after 2015. The current usage metrics is available 48-96 hours after online publication and is updated daily on week days.
Initial download of the metrics may take a while.