Fig. 11
Download original image
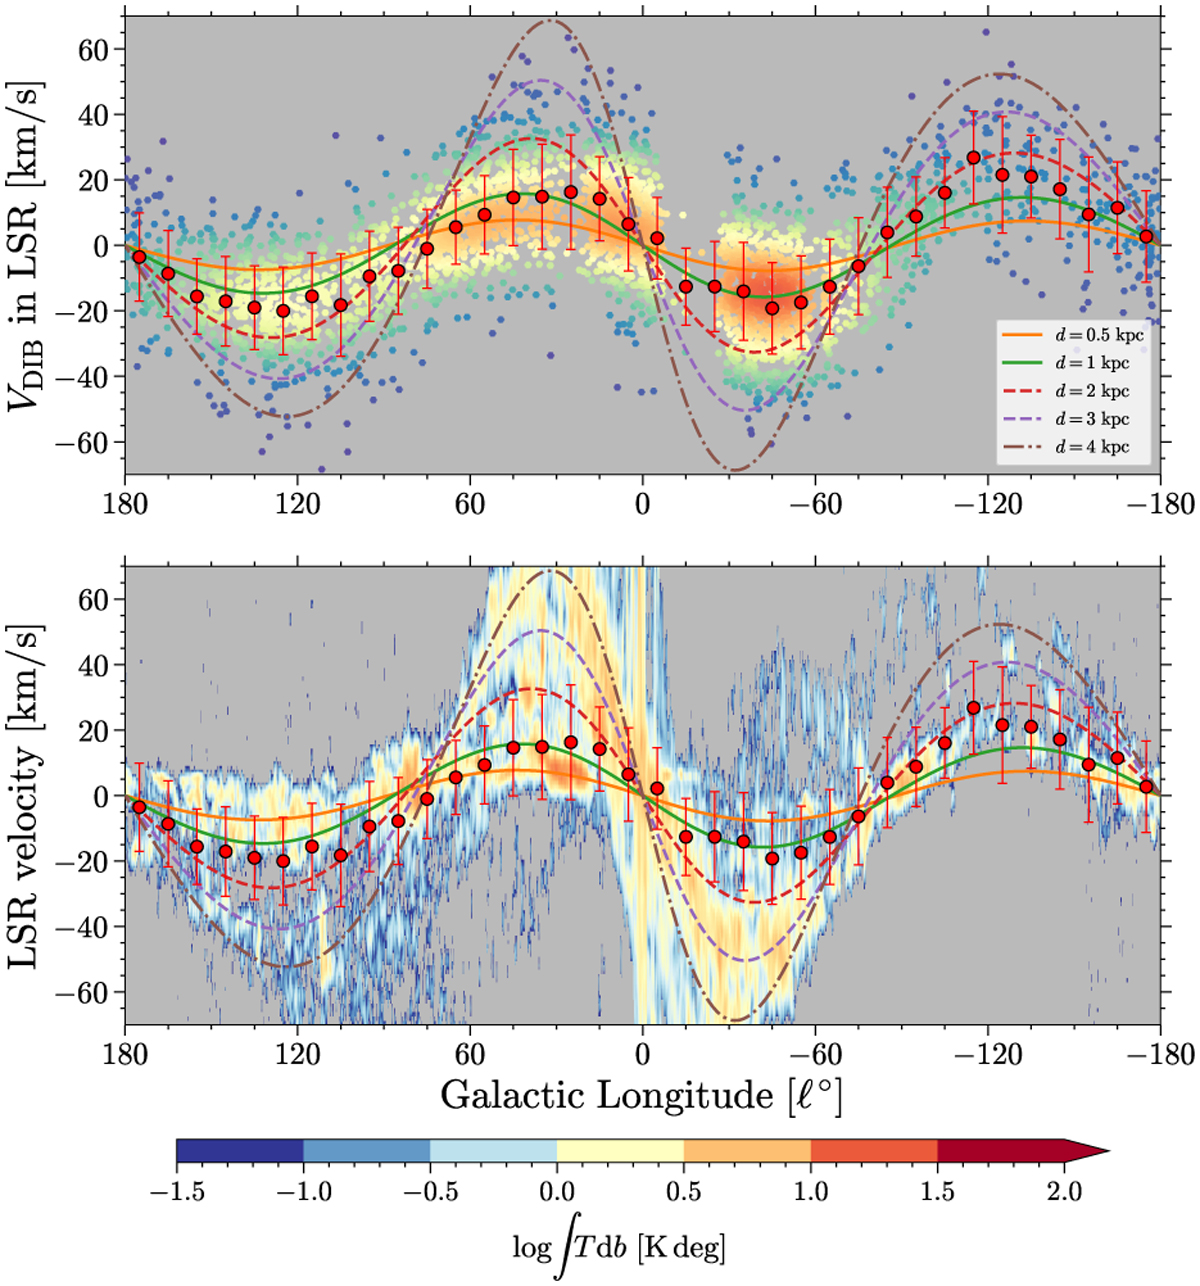
Longitude-velocity diagram for DIB λ8621 and 12CO. Upper panel: variation of the radial velocity of DIB λ8621 carrier (VDIB) along with the Galactic longitude for 3592 selected DIB measurements. The points are colored by their number density estimated by the Gaussian KDE. The red dots with error bars are the median VDIB calculated in each longitude bin with a step of 10°. The colored lines are theoretical rotation curves calculated with the rotation model in Reid et al. (2019) with different distances from the Sun. Lower panel: median VDIB superimposed on the longitude-velocity map of 12CO J = (1−0) emission from Dame et al. (2001). The color scale displays the 12CO latitude-integrated intensity on a logarithmic scale.
Current usage metrics show cumulative count of Article Views (full-text article views including HTML views, PDF and ePub downloads, according to the available data) and Abstracts Views on Vision4Press platform.
Data correspond to usage on the plateform after 2015. The current usage metrics is available 48-96 hours after online publication and is updated daily on week days.
Initial download of the metrics may take a while.