Fig. 12
Download original image
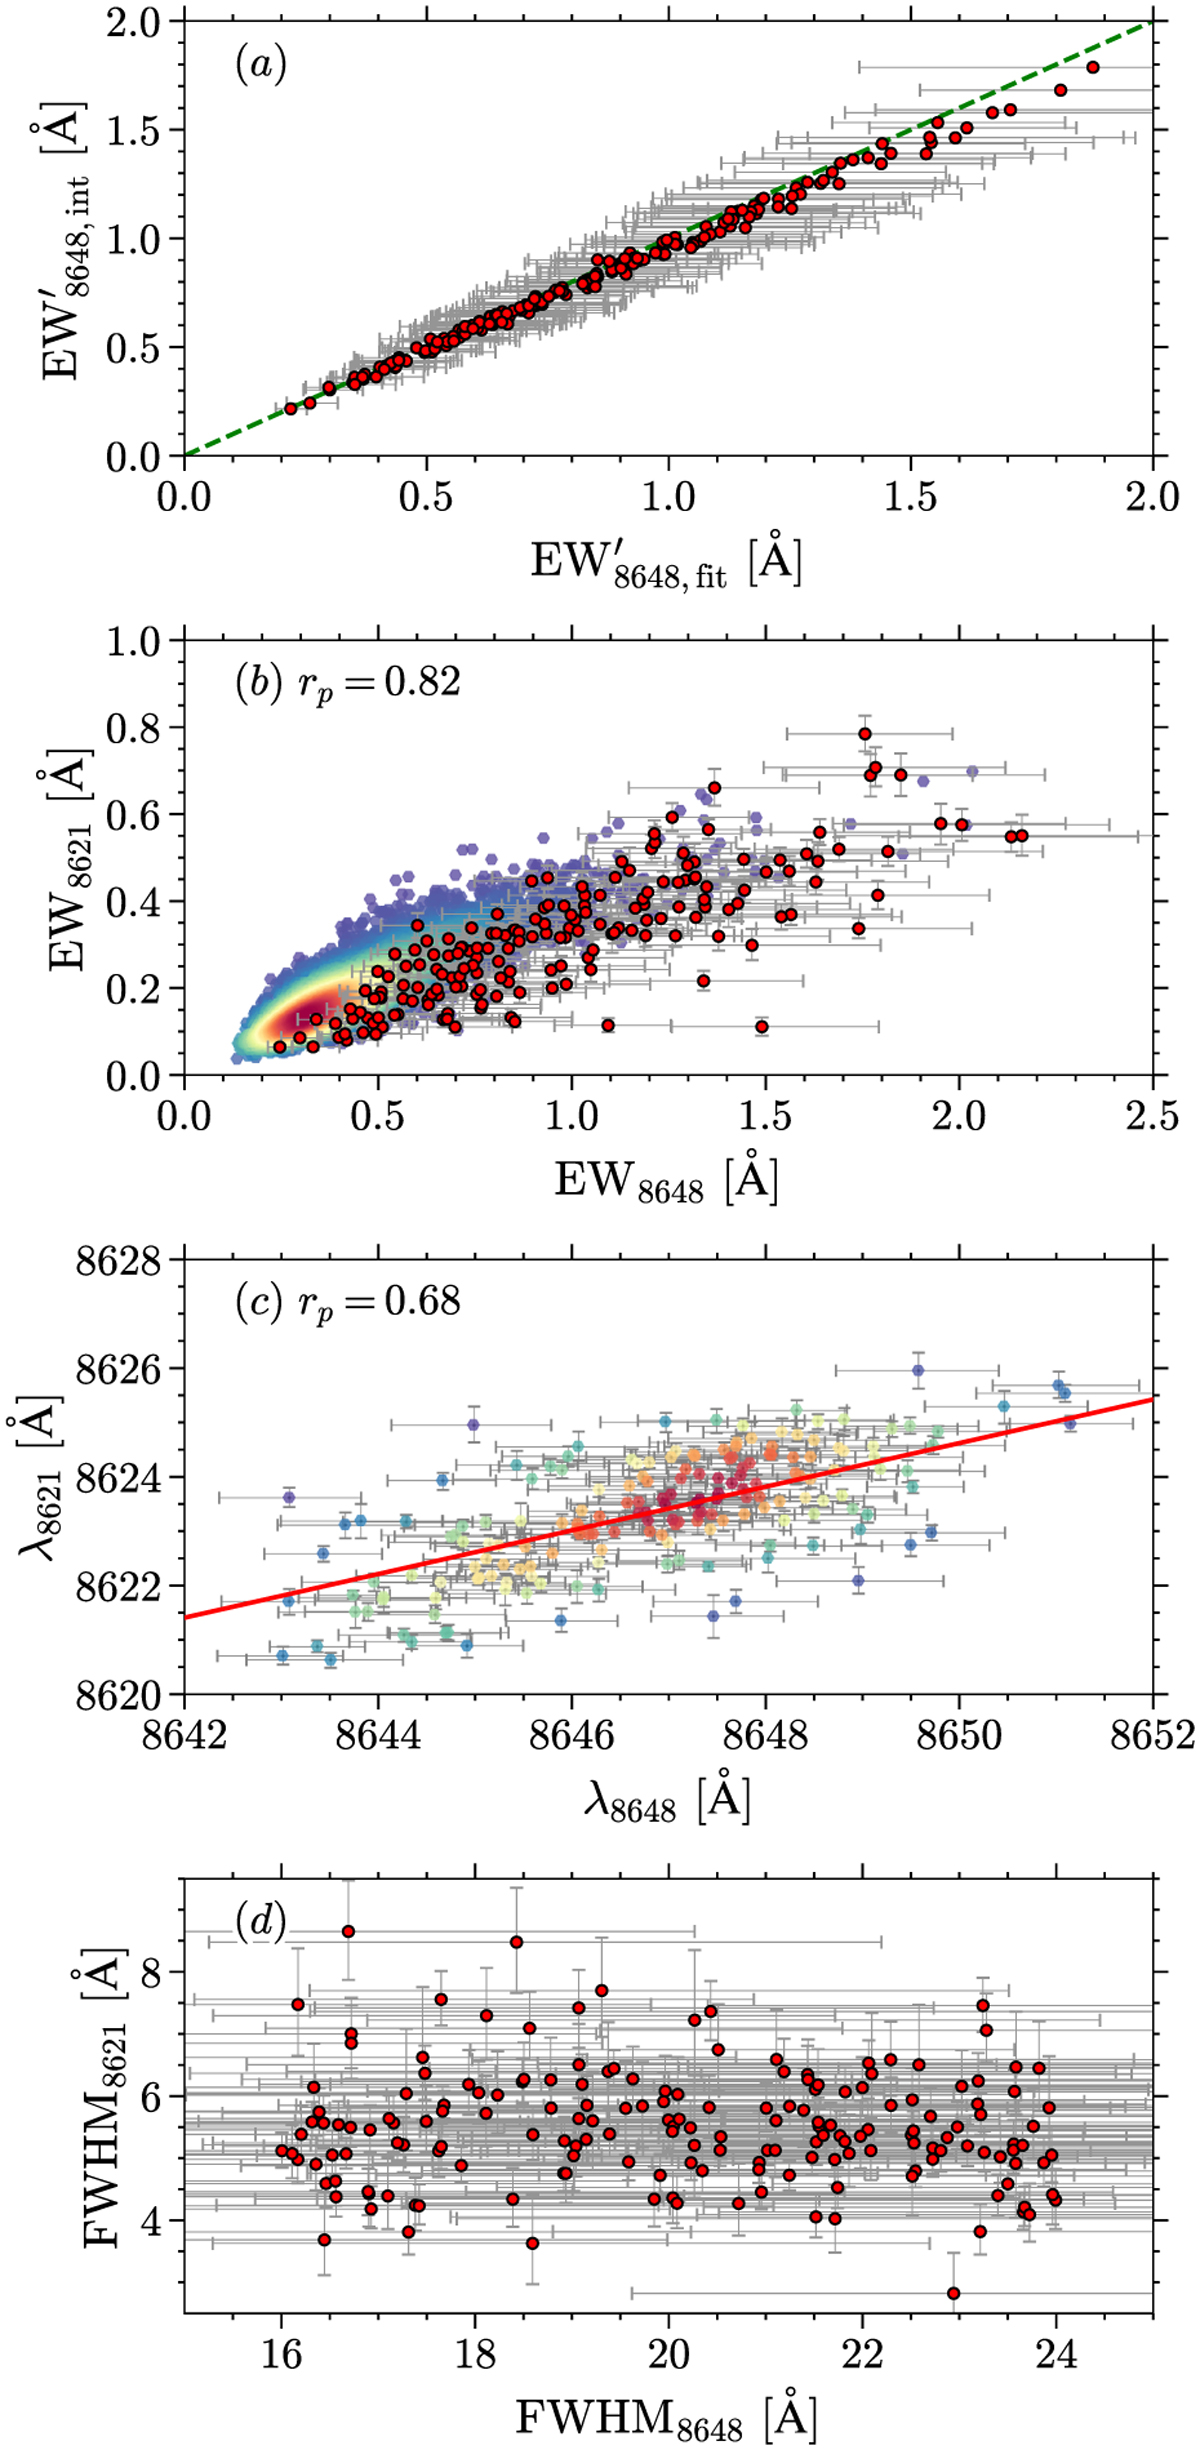
Correlations between DIBs λ8621 and λ8648 for 179 selected measurements for (a) fit and integrated EW8648 outside the masked region between 8660 and 8668 Å; (b) fit EW; (c) measured central wavelength; and (d) FWHM. The dashed green line in panel a traces the one-to-one correspondence. The colored points in panel b are the results from GFPR. The color in panel c represents the number density estimated by the Gaussian KDE, and the red line is a linear fit to all the data points. The Pearson coefficient (rp) of the correlation between the parameters of λ8621 and λ8648 for the 179 selected measurements is indicated in panels b and c.
Current usage metrics show cumulative count of Article Views (full-text article views including HTML views, PDF and ePub downloads, according to the available data) and Abstracts Views on Vision4Press platform.
Data correspond to usage on the plateform after 2015. The current usage metrics is available 48-96 hours after online publication and is updated daily on week days.
Initial download of the metrics may take a while.