Open Access
Fig. 13
Download original image
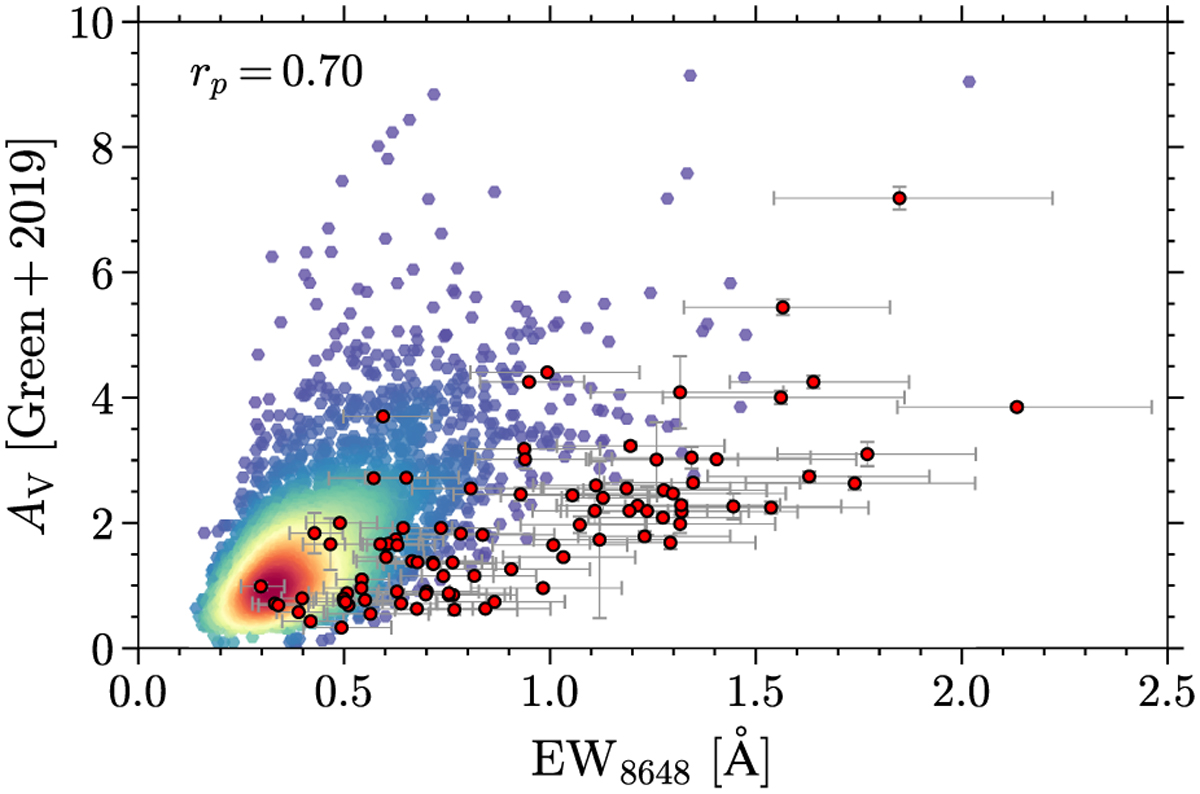
Correlation between EW8648 and AV from Green et al. (2019) for 93 selected measurements. The underlying points are the results from GFPR, colored by the number density. The Pearson coefficient (rp) for the red dots is indicated as well.
Current usage metrics show cumulative count of Article Views (full-text article views including HTML views, PDF and ePub downloads, according to the available data) and Abstracts Views on Vision4Press platform.
Data correspond to usage on the plateform after 2015. The current usage metrics is available 48-96 hours after online publication and is updated daily on week days.
Initial download of the metrics may take a while.