Fig. 14
Download original image
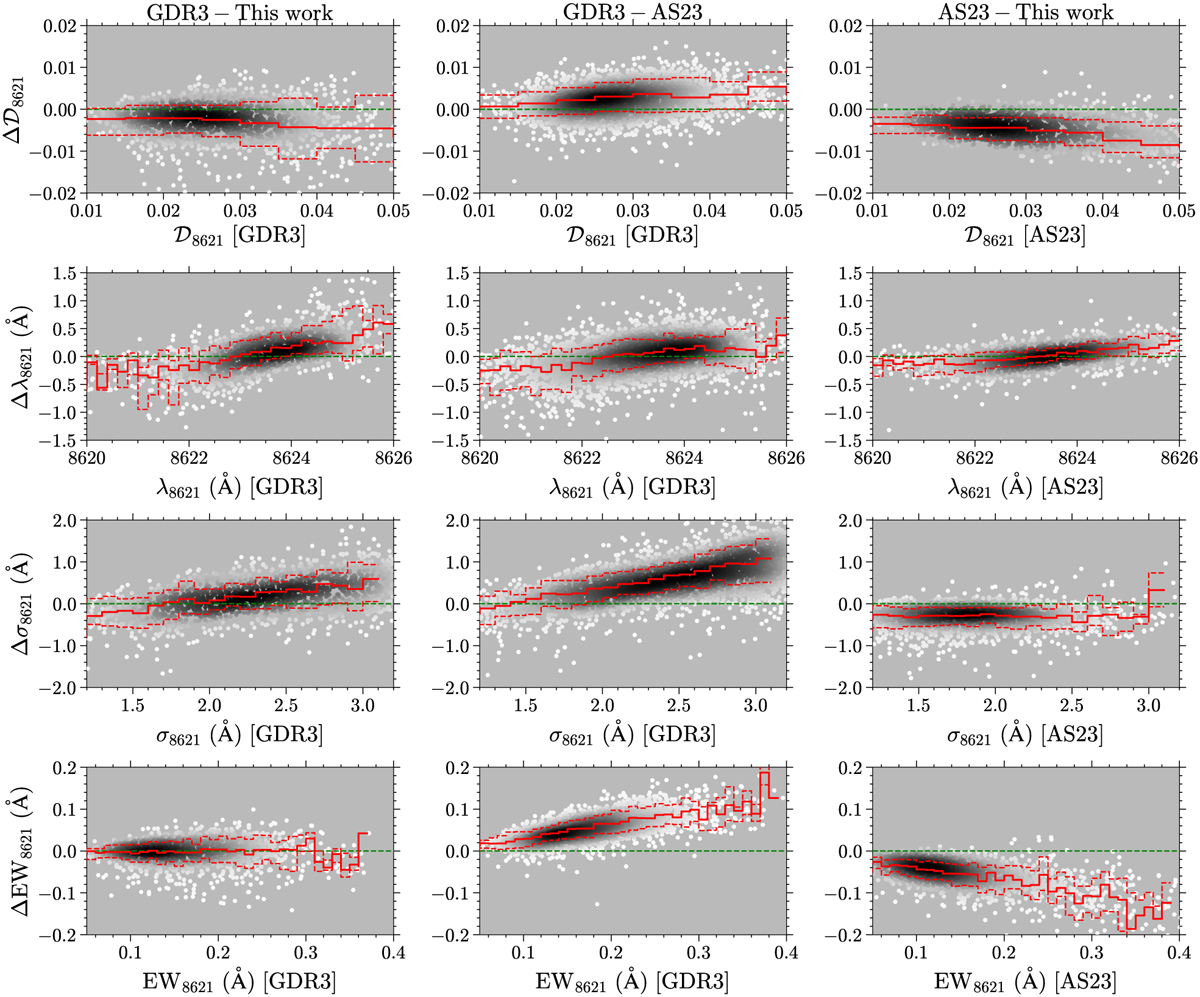
Difference in DIB parameters (𝒟8621, λ8621, σ8621, and EW8621) between GDR3, AS23, and this work as a function of the fit values for the joint samples. The gray scale indicates the number density of the data points estimated by the Gaussian KDE. The data are binned with a step of 0.005 for 𝒟8621, 0.2 Å for λ8621, 0.1 Å for σ8621, and 0.01 Å for EW8621. The solid red lines in each panel represent the median differences in each bin, and the two dashed red lines show the 16th and 84th percentiles.
Current usage metrics show cumulative count of Article Views (full-text article views including HTML views, PDF and ePub downloads, according to the available data) and Abstracts Views on Vision4Press platform.
Data correspond to usage on the plateform after 2015. The current usage metrics is available 48-96 hours after online publication and is updated daily on week days.
Initial download of the metrics may take a while.