Fig. 15
Download original image
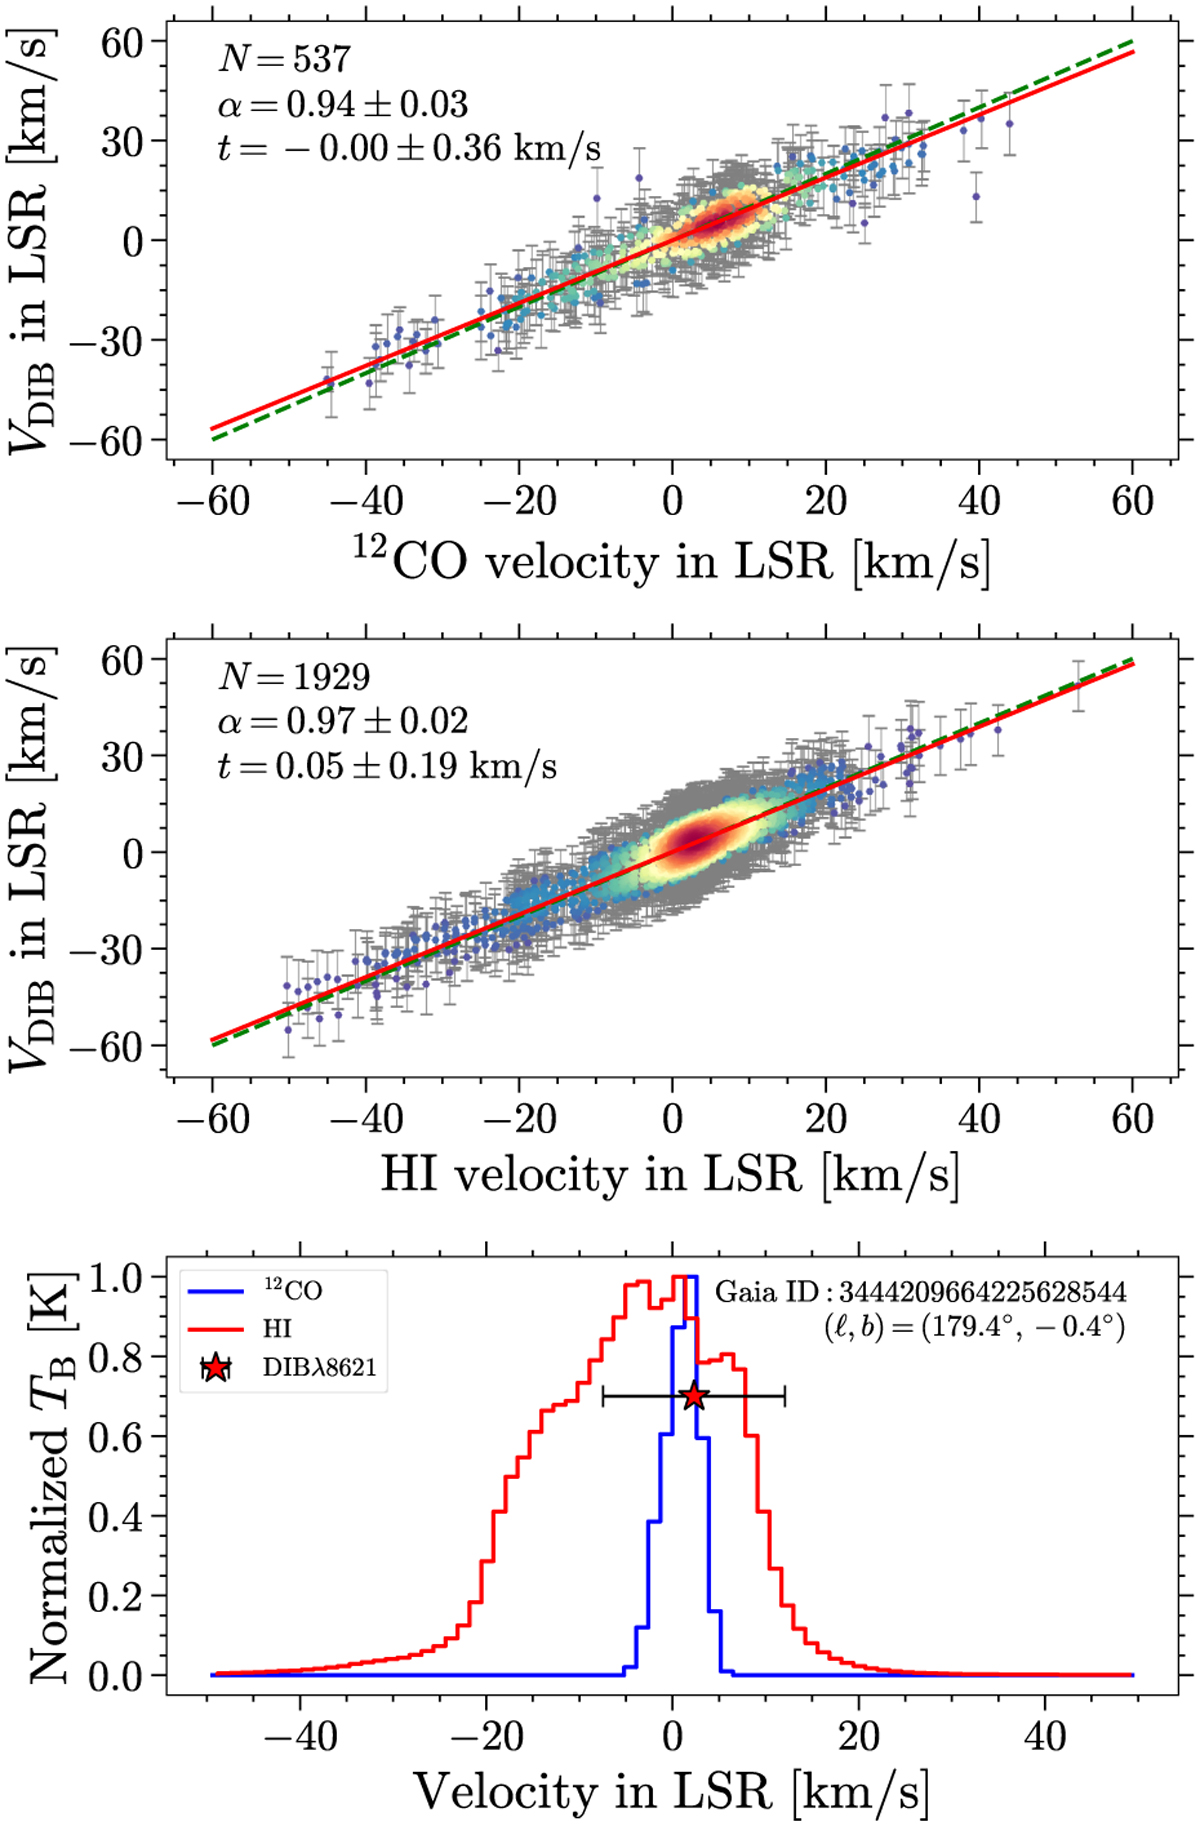
Correlation in velocity between DIB 18621, 12CO and H I. Upper and middle panels: correlation between the DIB λ8621 velocity (VDIB) and the in tensity-weighted velocity of the nearest12 CO (Dame et al. 2001) and H I (HI4PI Collaboration 2016) component. The color scale indicates the number density of the data points estimated by the Gaussian KDE. The error of VDIB is simply estimated by the uncertainty of λ8621. The red line is the linear fit to the LSR velocities. The fit slope (α) and intercept (t), as well as the number of the points, are indicated. The dashed green line traces the one-to-one correspondence. Lower panel: example of the peak-finding method (see Sect. 5.1). The red and blue lines are the spectra of 12CO and H I, respectively, toward the same sightline. The red star indicates the LSR velocity of the DIB signal detected on this sightline. The Galactic coordinate (ℓ,b) and the Gaia source ID of the background star are marked.
Current usage metrics show cumulative count of Article Views (full-text article views including HTML views, PDF and ePub downloads, according to the available data) and Abstracts Views on Vision4Press platform.
Data correspond to usage on the plateform after 2015. The current usage metrics is available 48-96 hours after online publication and is updated daily on week days.
Initial download of the metrics may take a while.