Open Access
Fig. 16
Download original image
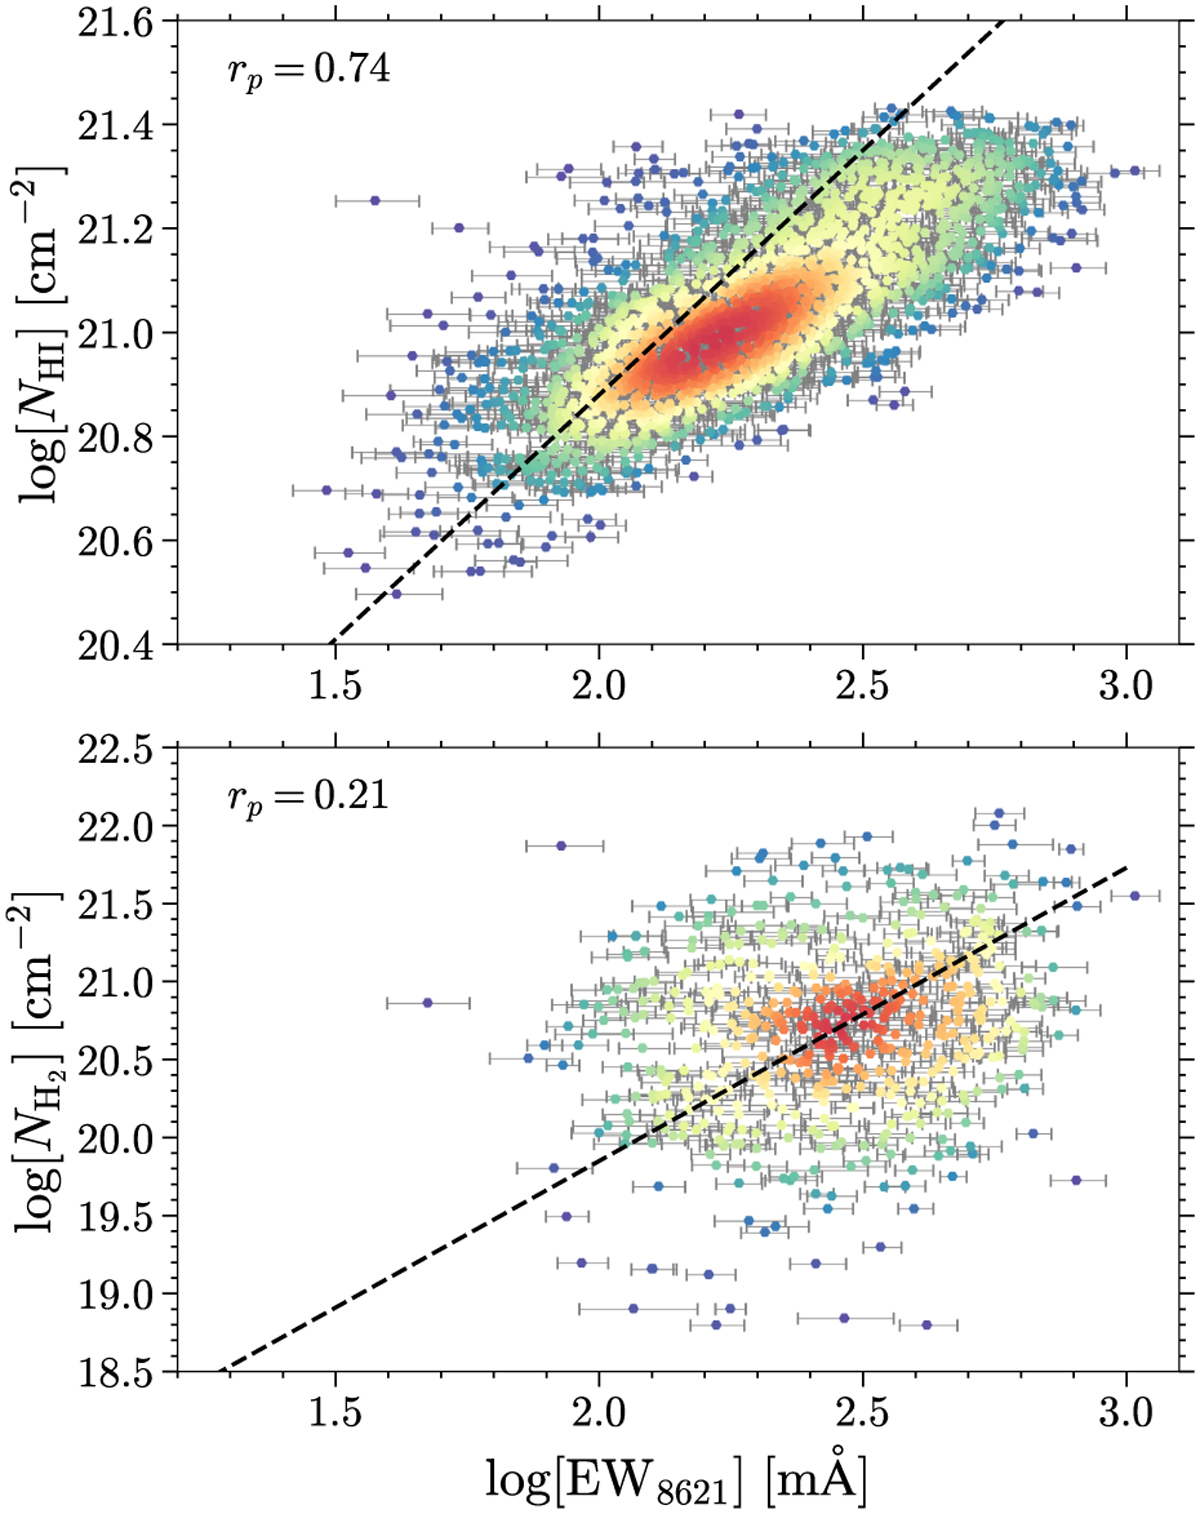
Correlation between EW8621 and NH I (upper panel) and between EW8621 and ![]() (lower panel) on a logarithmic scale. The Pearson coefficient (rp) is indicated. The color scale indicates the number density. The dashed lines are the linear fit results from Friedman et al. (2011), but for DIB λ5780.
(lower panel) on a logarithmic scale. The Pearson coefficient (rp) is indicated. The color scale indicates the number density. The dashed lines are the linear fit results from Friedman et al. (2011), but for DIB λ5780.
Current usage metrics show cumulative count of Article Views (full-text article views including HTML views, PDF and ePub downloads, according to the available data) and Abstracts Views on Vision4Press platform.
Data correspond to usage on the plateform after 2015. The current usage metrics is available 48-96 hours after online publication and is updated daily on week days.
Initial download of the metrics may take a while.