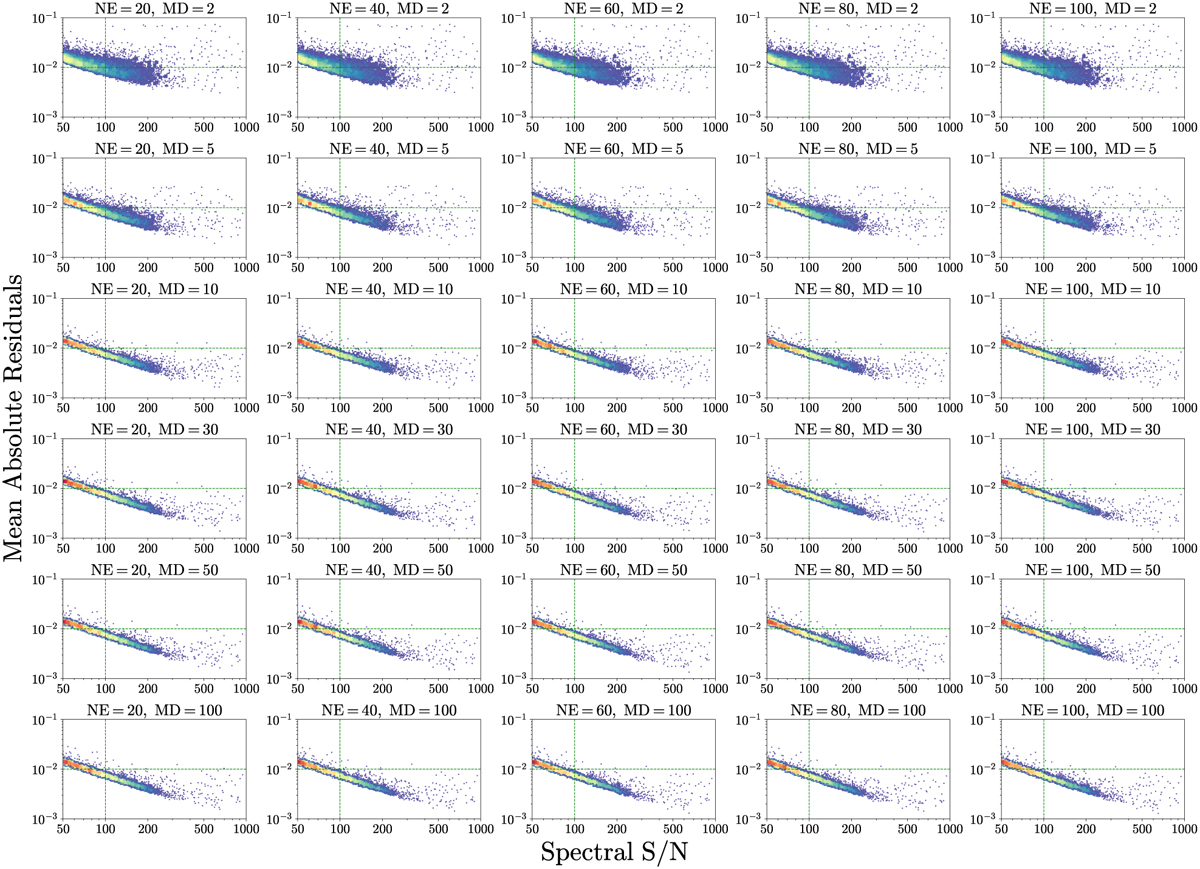
Fig. A.2
Download original image
Mean of the absolute residuals (MAR) between observed and modeled normalized fluxes, taken along the wavelength in the DIB window, for each RVS spectrum in the validation set (7324) as a function of the spectral S/N. The color represents the number density of the spectra. The dashed green lines indicate MAR = 0.01 and S/N = 100 in each panel.
Current usage metrics show cumulative count of Article Views (full-text article views including HTML views, PDF and ePub downloads, according to the available data) and Abstracts Views on Vision4Press platform.
Data correspond to usage on the plateform after 2015. The current usage metrics is available 48-96 hours after online publication and is updated daily on week days.
Initial download of the metrics may take a while.