Fig. B.1
Download original image
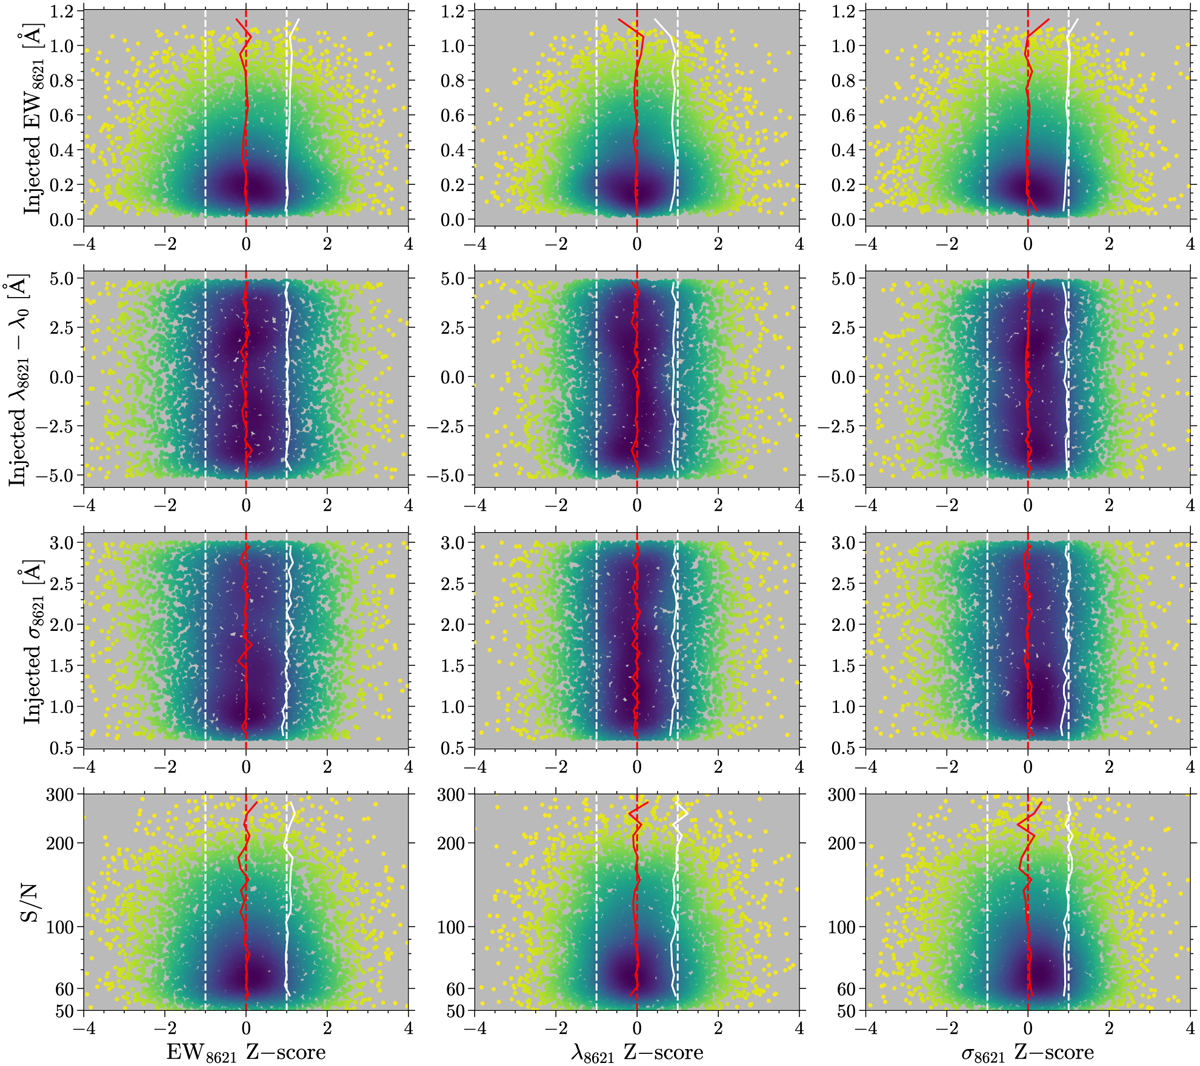
Distributions of the Z-scores computed from the injection tests of EW8621, λ8621, and σ8621 as a function of the injected DIB parameters and the S/N of the ISM spectra. The color scale indicates the number density estimated by the Gaussian KDE. In each panel, the solid red line indicates the variation in the mean differences of Z-scores with the injected DIB parameters and the S/N. The solid white line indicates the mean absolute differences of the Z-scores. The dashed red and white lines provide a reference for Z-score equals 0 and ±1.
Current usage metrics show cumulative count of Article Views (full-text article views including HTML views, PDF and ePub downloads, according to the available data) and Abstracts Views on Vision4Press platform.
Data correspond to usage on the plateform after 2015. The current usage metrics is available 48-96 hours after online publication and is updated daily on week days.
Initial download of the metrics may take a while.