Open Access
Fig. D.1
Download original image
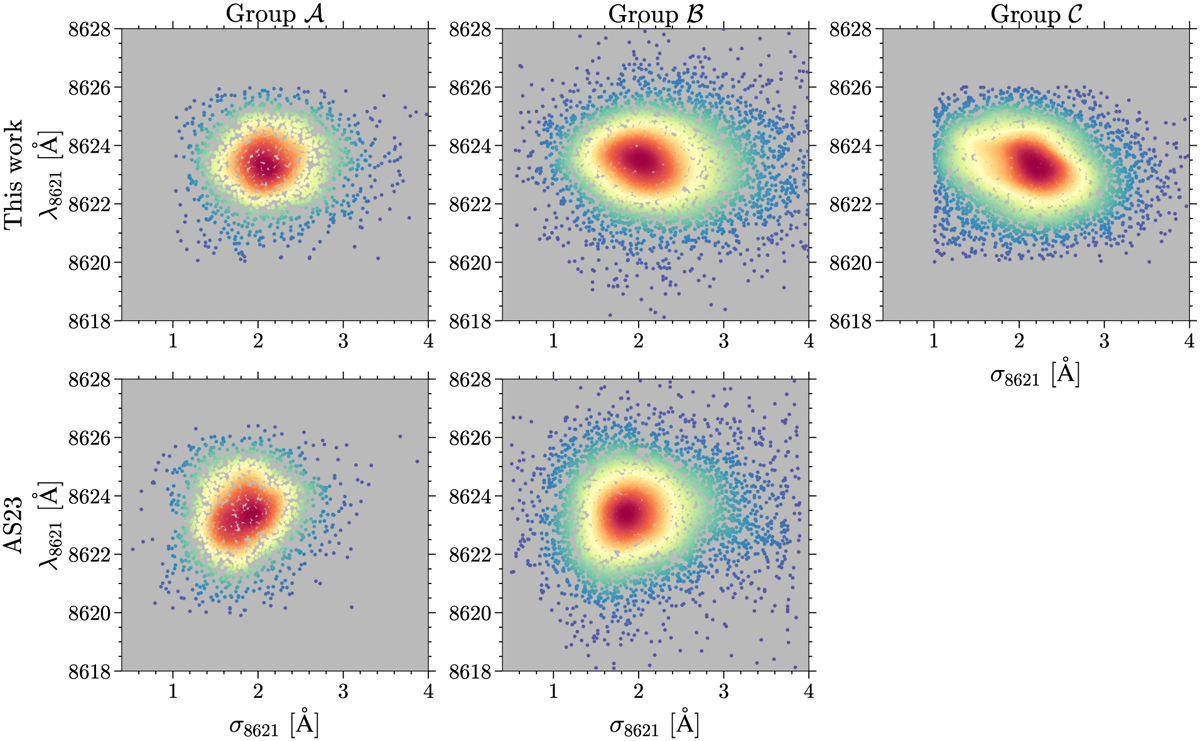
σ8621 – λ8621 distributions for the different groups defined in Appendix D. The DIB parameters in the first row come from this work, and those in the second row come from AS23. The color of the scattered points represents their number density estimated by the Gaussian KDE.
Current usage metrics show cumulative count of Article Views (full-text article views including HTML views, PDF and ePub downloads, according to the available data) and Abstracts Views on Vision4Press platform.
Data correspond to usage on the plateform after 2015. The current usage metrics is available 48-96 hours after online publication and is updated daily on week days.
Initial download of the metrics may take a while.