Fig. 3
Download original image
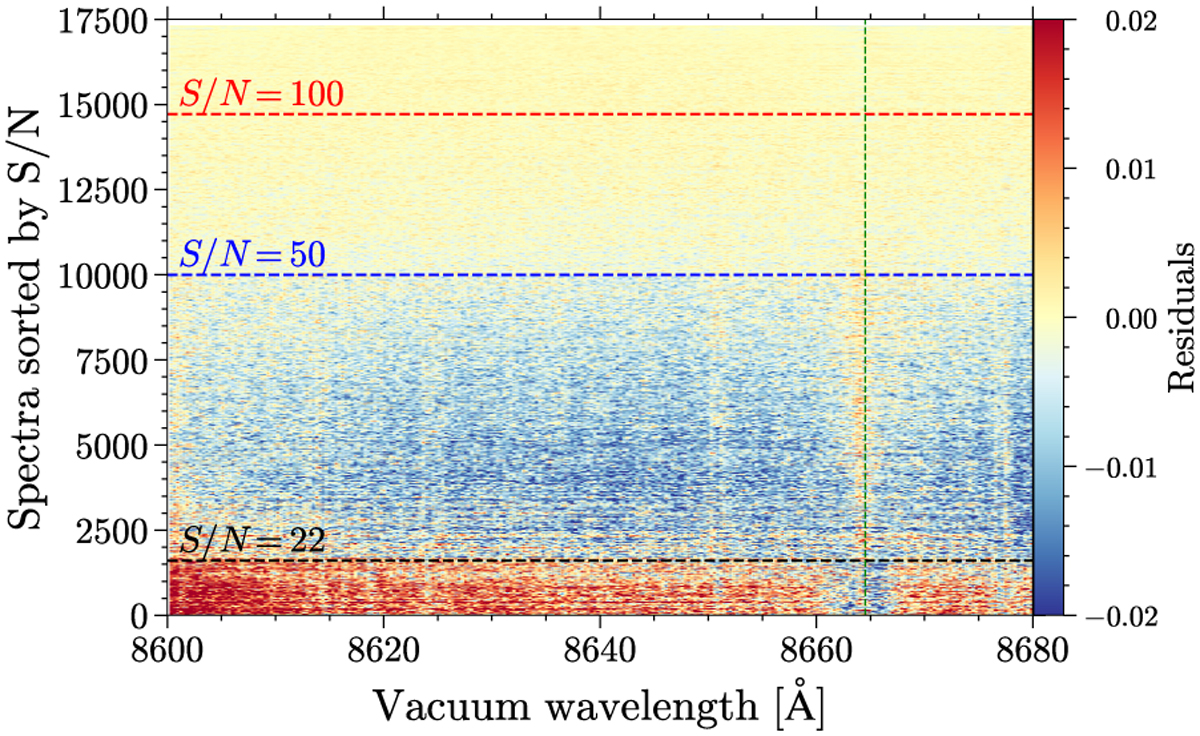
Residuals between the observed and modeled normalized fluxes as a function of the wavelength for the 17 324 RVS spectra in the testing set. The color represents the residuals, and the spectra are sorted by spectral S/N, increasing from bottom to top. S/N = 22, 50, and 100 is indicated by the dashed black, blue, and red lines, respectively. The Ca II line within the DIB window is marked as a dashed green line.
Current usage metrics show cumulative count of Article Views (full-text article views including HTML views, PDF and ePub downloads, according to the available data) and Abstracts Views on Vision4Press platform.
Data correspond to usage on the plateform after 2015. The current usage metrics is available 48-96 hours after online publication and is updated daily on week days.
Initial download of the metrics may take a while.