Fig. 4
Download original image
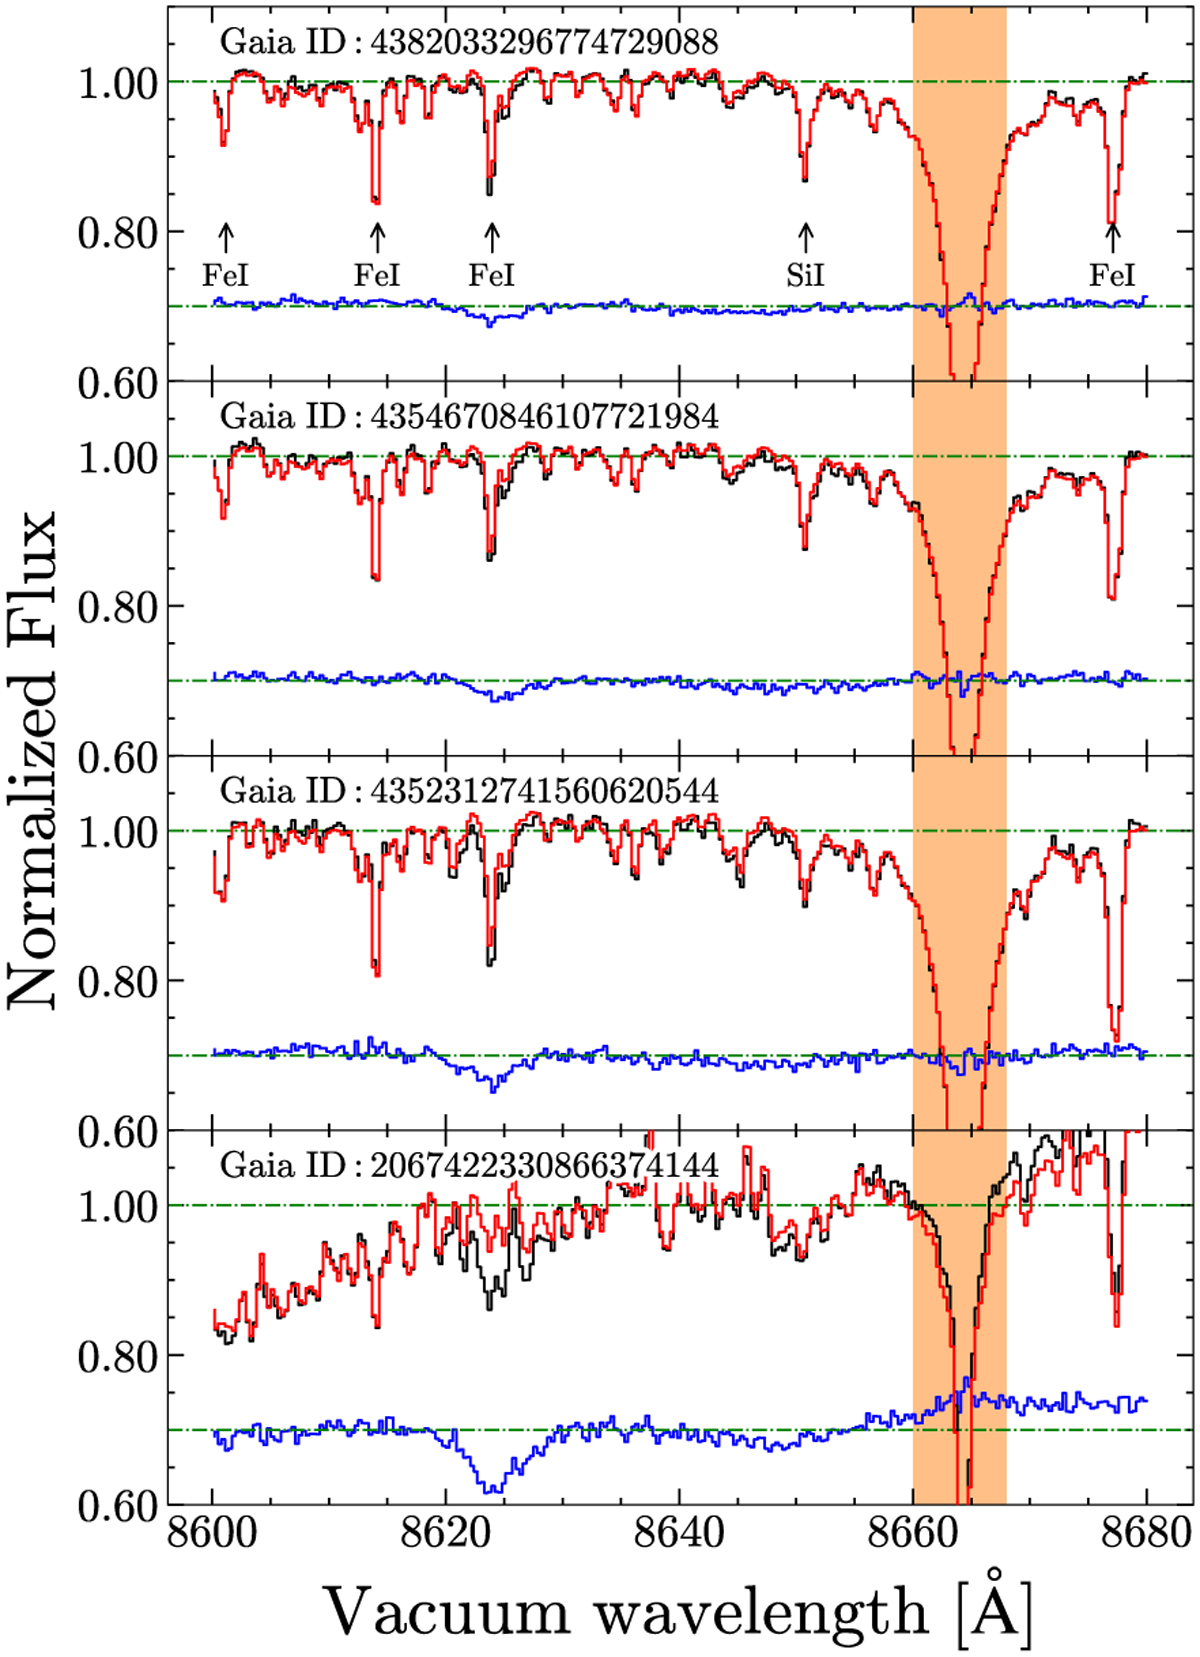
Four examples of the RF prediction within the DIB window. The black and red lines are the observed RVS spectra and the predicted stellar parameters, respectively. The blue line is the derived ISM spectrum with an offset of 0.3 for the normalized flux. Orange marks the masked region during the fittings. The Gaίa source ID of these targets is indicated. Some typical stellar lines within the DIB window determined by Contursi et al. (2021) are marked as well. The DIB fitting to these ISM spectra is shown in Fig. 5.
Current usage metrics show cumulative count of Article Views (full-text article views including HTML views, PDF and ePub downloads, according to the available data) and Abstracts Views on Vision4Press platform.
Data correspond to usage on the plateform after 2015. The current usage metrics is available 48-96 hours after online publication and is updated daily on week days.
Initial download of the metrics may take a while.