Fig. 5
Download original image
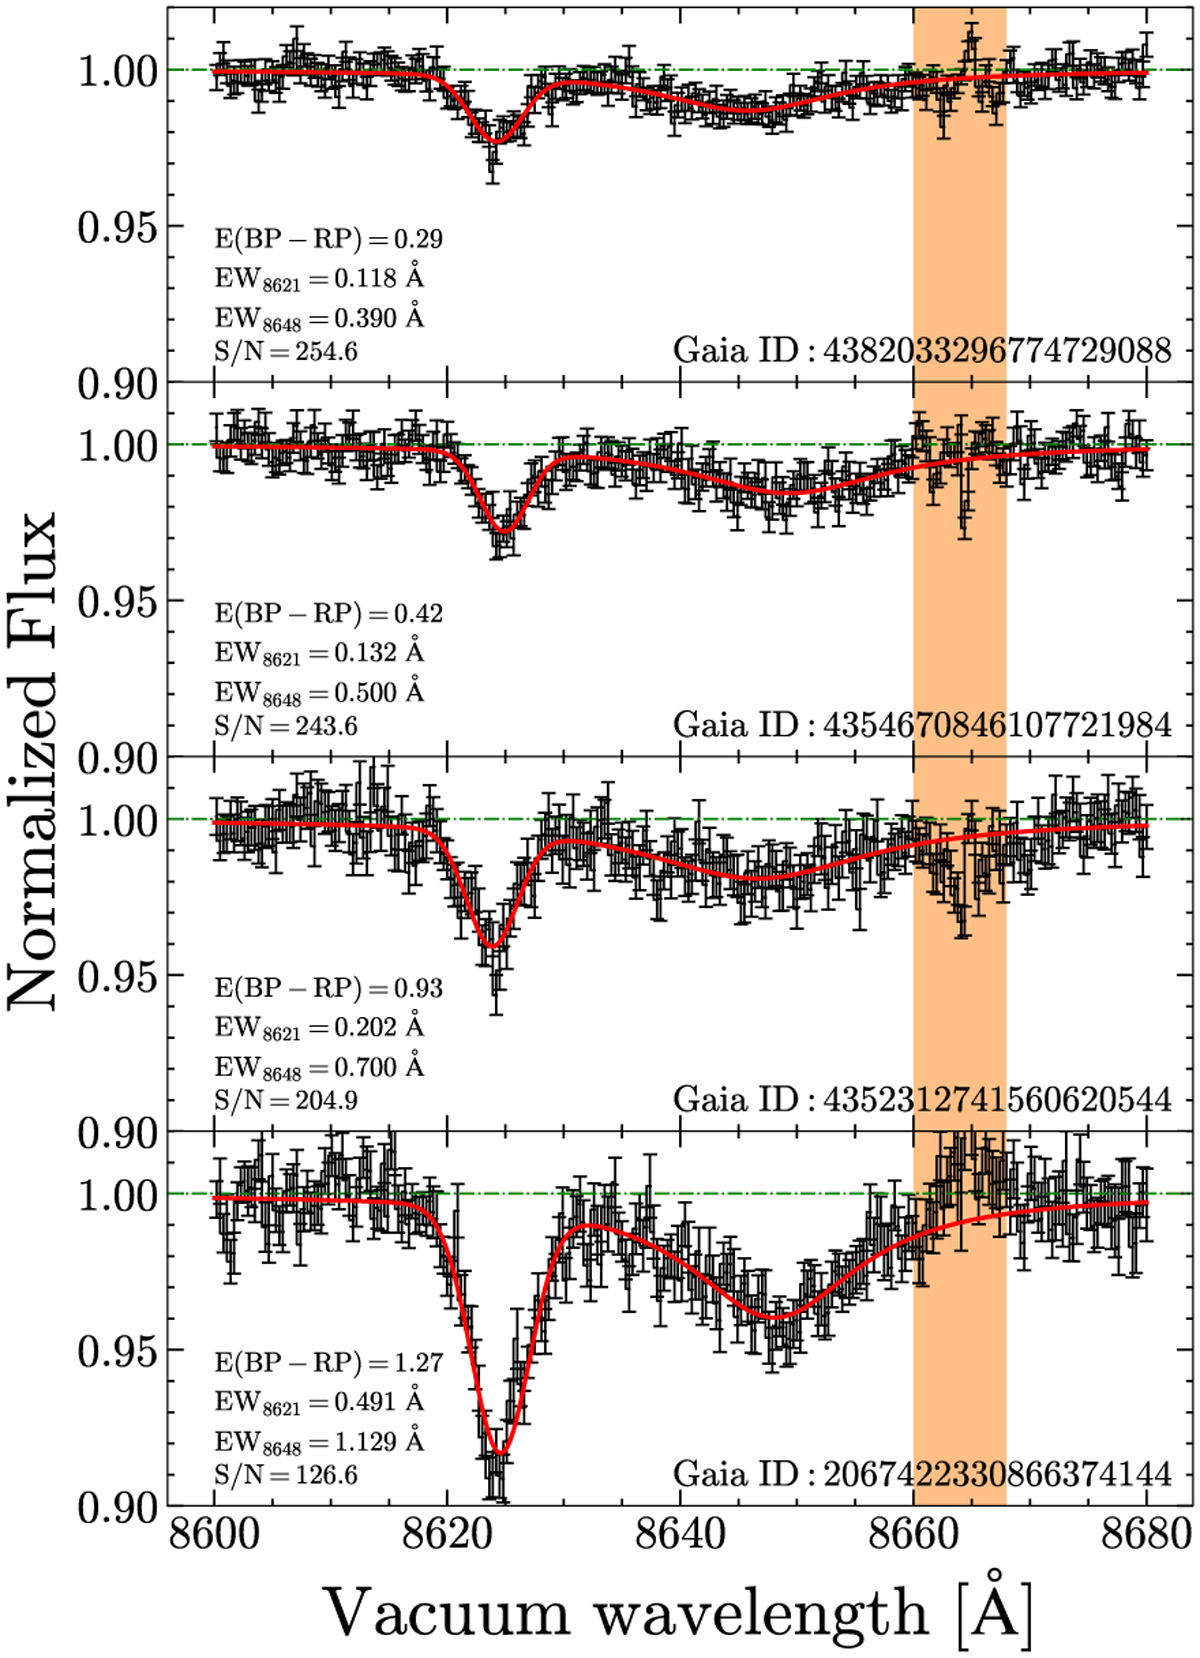
Examples of the fits to DIBs 18621 and λ8648 in four ISM spectra. The black and red lines are the ISM spectra and fit DIB pro-flies, respectively, normalized by the fit linear continuum. The error bars indicate the observational flux uncertainties of the RVS spectra. Orange marks the masked region during the fittings. The Gaίa source ID of these targets, E(BP − RP) from Andrae et al. (2023), the EWs of the two DIBs (EW8621 and EW8648), and the S/N of the ISM spectra are indicated as well.
Current usage metrics show cumulative count of Article Views (full-text article views including HTML views, PDF and ePub downloads, according to the available data) and Abstracts Views on Vision4Press platform.
Data correspond to usage on the plateform after 2015. The current usage metrics is available 48-96 hours after online publication and is updated daily on week days.
Initial download of the metrics may take a while.