Fig. 9
Download original image
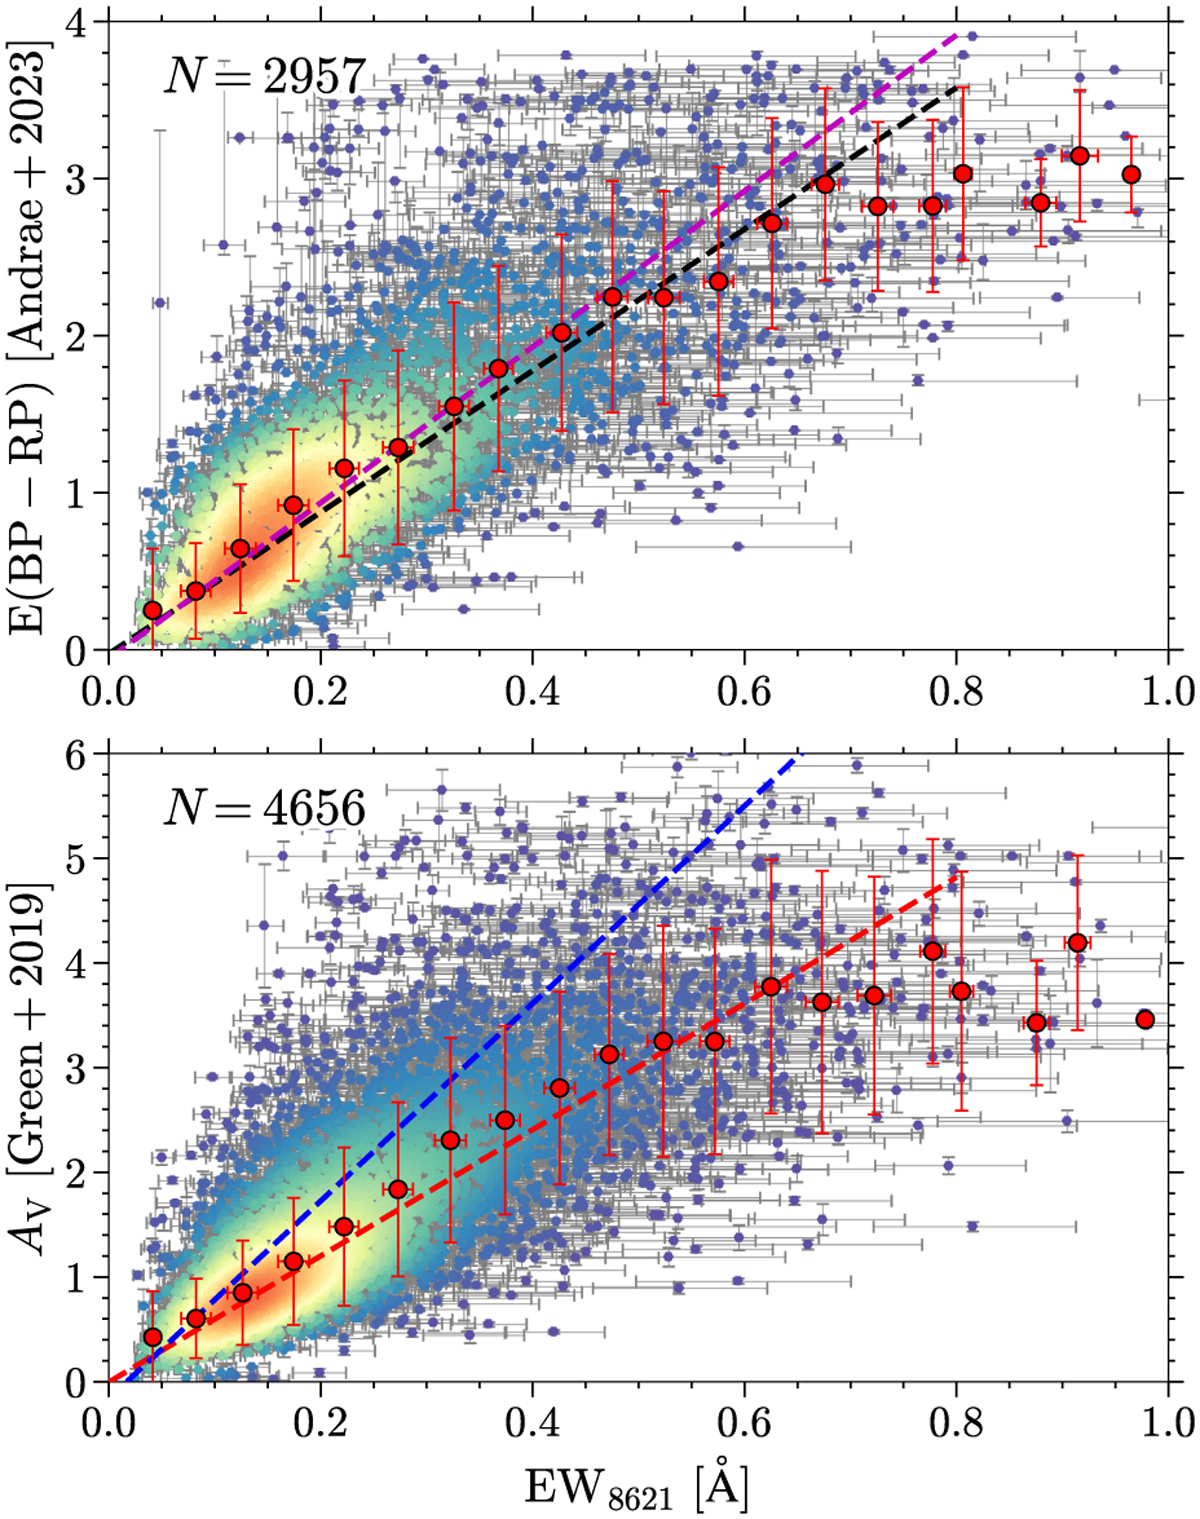
Correlation between EW8621 and dust reddening for 2957 cases with E(BP − RP) from Andrae et al. (2023) shown in the upper panel and for 4656 cases with Av from Green et al. (2019) shown in the lower panel. The color of the scattered points represents their number density estimated by the Gaussian KDE. The red dots and their color bars are the median values and the standard deviations calculated in each EW8621 bin with a step of 0.05 Å. The linear fits to EW8621 and dust reddening from previous works are overplotted as dashed lines: magenta for GFPR, black and red for GDR3, and blue for AS 23.
Current usage metrics show cumulative count of Article Views (full-text article views including HTML views, PDF and ePub downloads, according to the available data) and Abstracts Views on Vision4Press platform.
Data correspond to usage on the plateform after 2015. The current usage metrics is available 48-96 hours after online publication and is updated daily on week days.
Initial download of the metrics may take a while.